Methodology
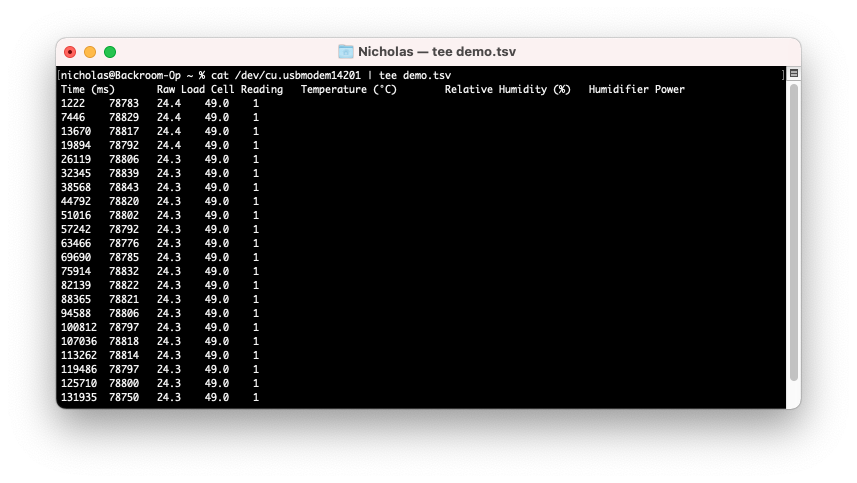
While the Arduino is running, it sends readings over the attached USB cable roughly every 5 seconds. These readings were captured on a MacOS laptop by running the following command in the Terminal application:
cat /dev/cu.usbmodem14201 | tee demo.tsv
The cat command reads data from the USB port, designated /dev/cu.usbmodem14101, and prints it to the standard output stream. The vertical bar, or pipe, directs that output into the tee command, which displays the data in the Terminal window while simultaneously writing it to a file named demo.tsv, which could later be imported into an application such as Excel or Tableau for analysis.
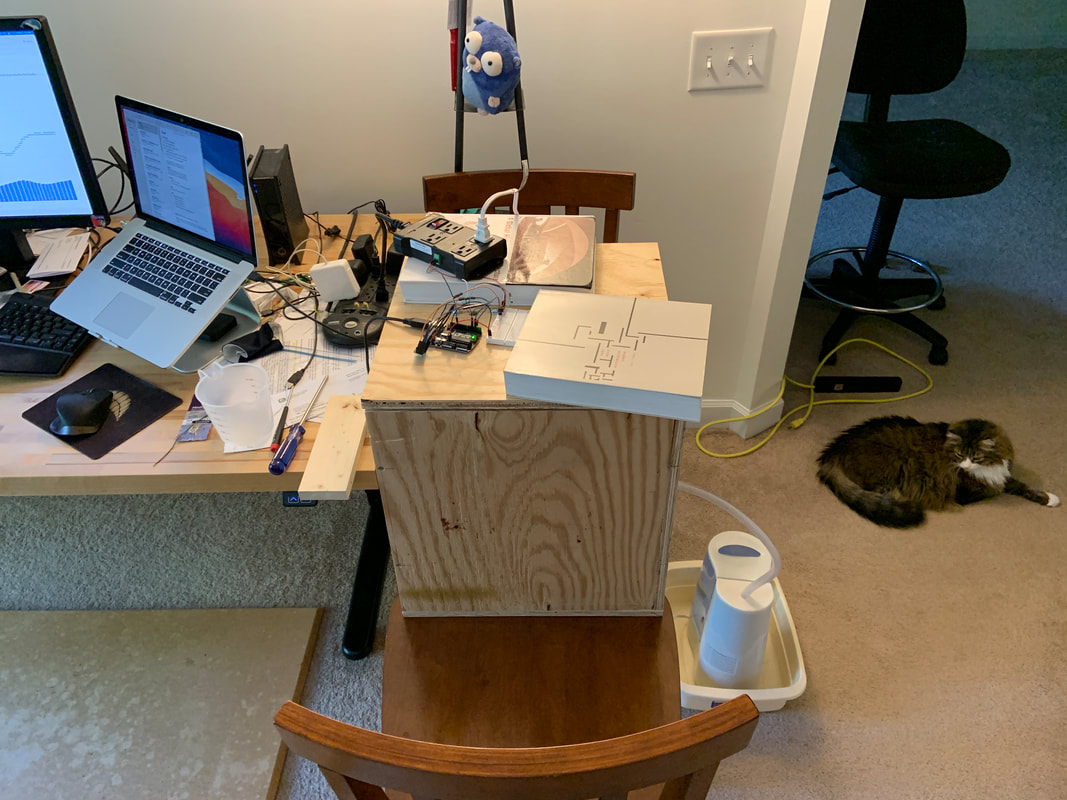
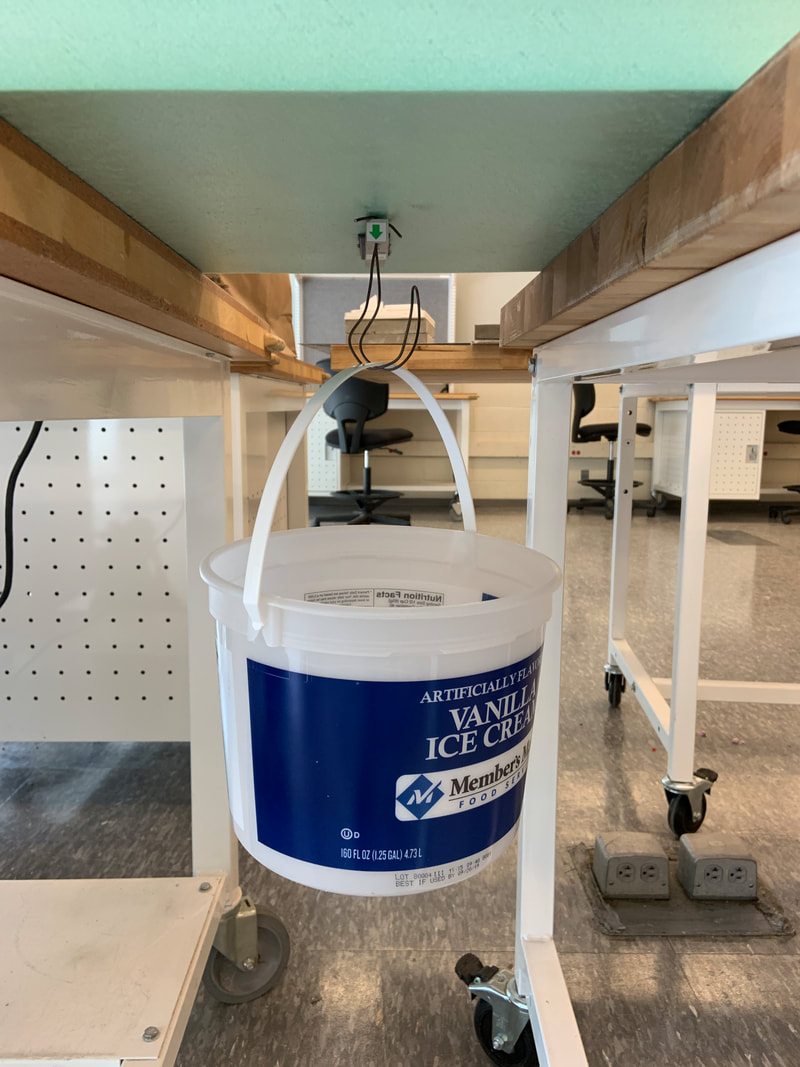
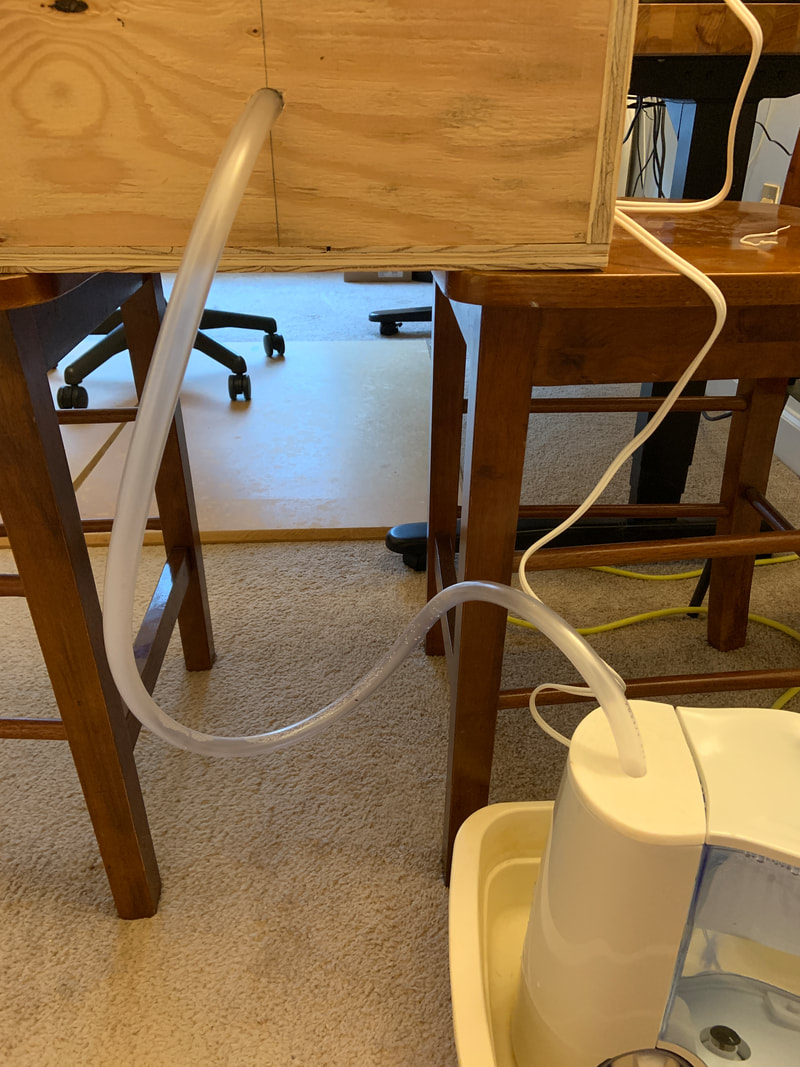
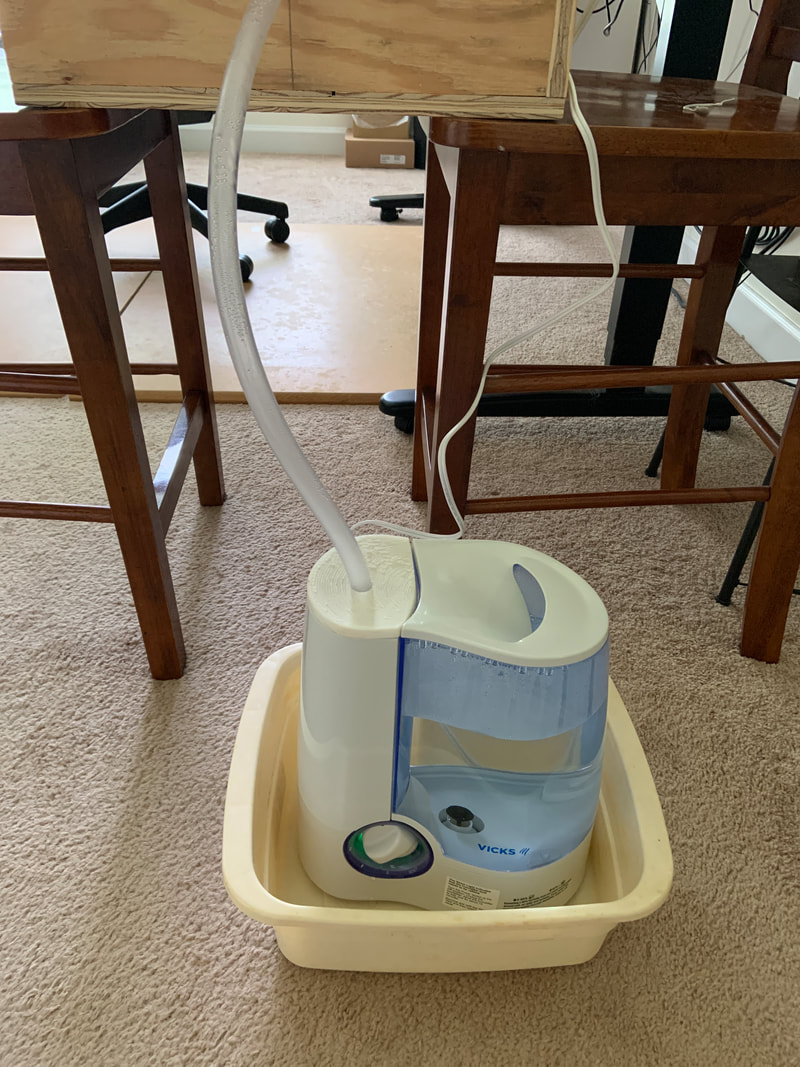
Because each test could last for hours, or even days, it was necessary to conduct them in the author's home where the laptop could remain unattended for extended periods of time without the threat of theft or tampering. The enclosure was elevated above the humidifier so that condensation that formed in the plastic tube connecting the two would flow back into the humidifier instead of to the test enclosure. The humidifier itself was placed in a dishpan to contain any leaks.
Before each test, the lid was removed for 5–10 minutes to allow the air inside the enclosure to match the air in the room, which averaged 45% relative humidity. During these few minutes, the text box had to be closely guarded to prevent feline infiltration. Once the interior conditions in the box had reached equilibrium, a test sample was hung from the load cell and the lid was replaced. Additional weight was placed on top of the lid in hope of more effectively sealing the test environment. The enclosure then sat idle for 15 minutes while the sample settled before the USB cable was plugged into the laptop to begin the test.
Before each test, the lid was removed for 5–10 minutes to allow the air inside the enclosure to match the air in the room, which averaged 45% relative humidity. During these few minutes, the text box had to be closely guarded to prevent feline infiltration. Once the interior conditions in the box had reached equilibrium, a test sample was hung from the load cell and the lid was replaced. Additional weight was placed on top of the lid in hope of more effectively sealing the test environment. The enclosure then sat idle for 15 minutes while the sample settled before the USB cable was plugged into the laptop to begin the test.
|
|
Calibration
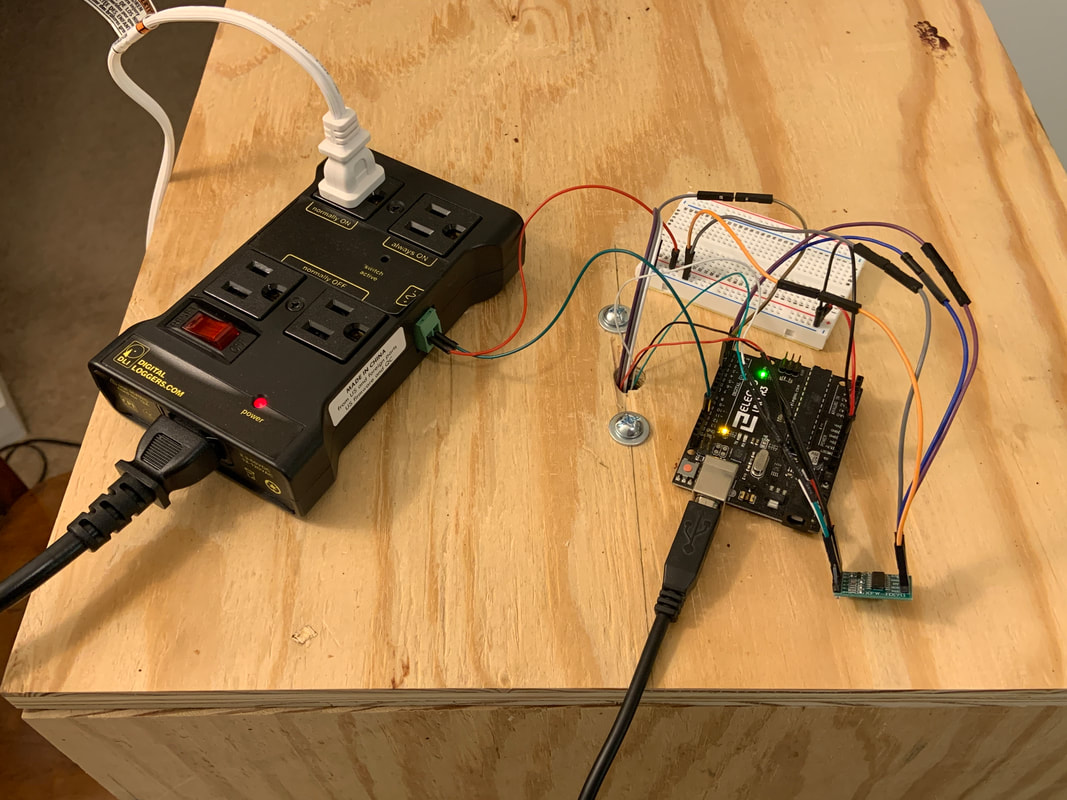
Unlike the DHT11, which yields readings in percents and degrees Celsius, the load cell produces dimensionless numbers that are the direct result of changes in resistance in its Wheatstone bridge. In order to convert these numbers into standard units of measure, scale and offset coefficients must be derived by calibrating the load cell. The calibration was performed by placing known volumes of water into a container suspended from the load cell. Because each milliliter of water at room temperature weights 1 gram, the known volumes of water could take the place of a set of known weights.
|
|
Readings were initially collected at constant load over a period of 30 minutes so that the noise inherent in the readings would be averaged out. However, early attempts to calibrate the load cell produced an unexpected result — the readings appeared to decrease over time despite the applied load remaining constant.
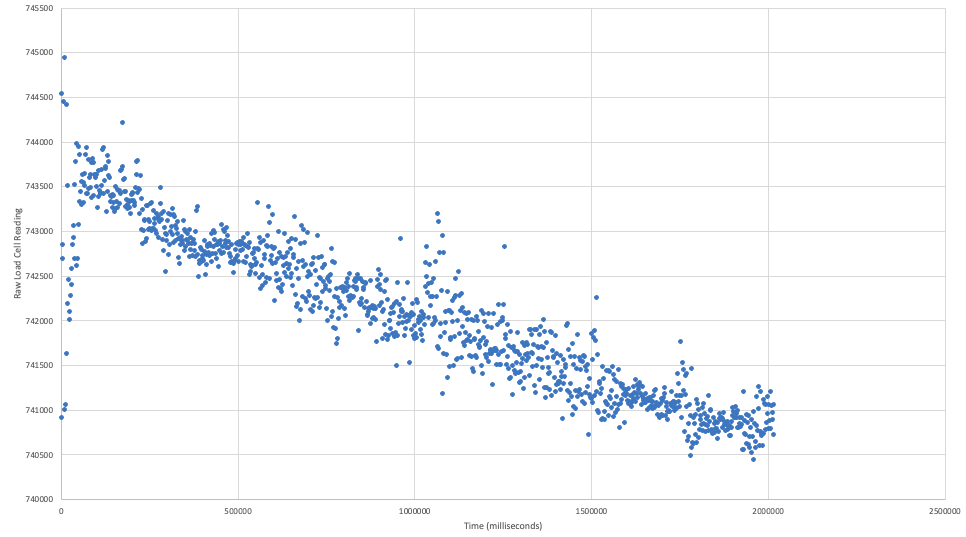
Creep, which is caused by a load cell adjusting to changes in strain over time, was initially assumed to be the cause of this unexpected result, so the calibration time for each known volume of water was extended. However, the longer calibration periods produced even more perplexing results.
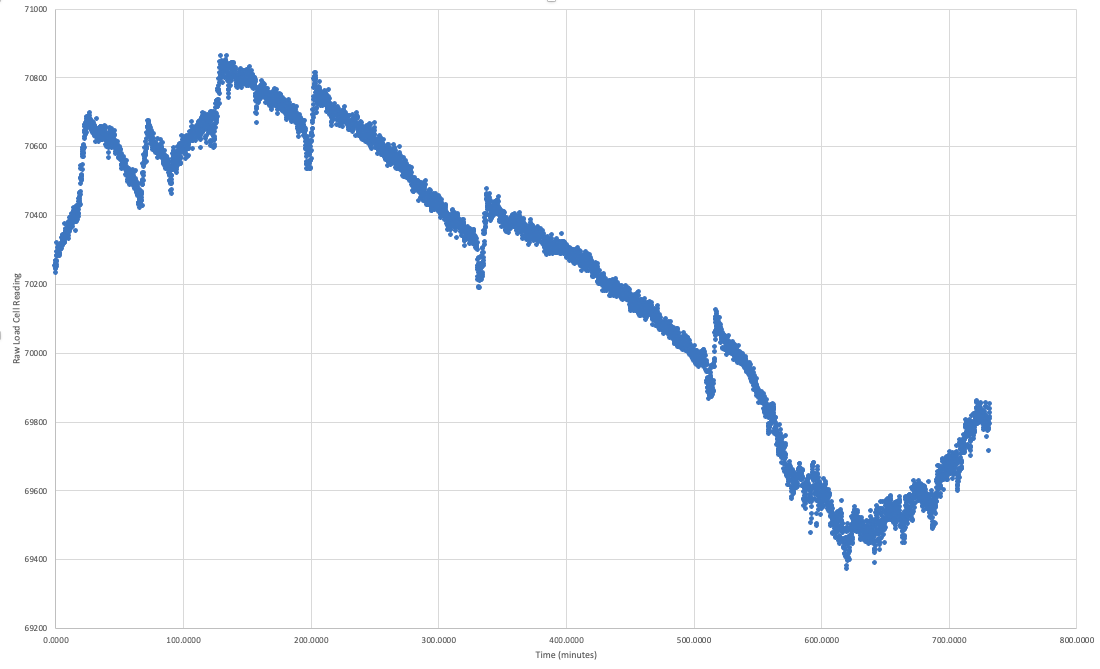
Eventually, it was realized that changes in temperature were responsible for the unexpected variation in readings. The bulk of the load cell consists of a block of aluminum, which expands and contracts as it warms and cools, affecting the resistance of the load cell's Wheatstone bridge and thus the readings it produces. The spikes in the chart below in fact correspond to the activation of the air conditioner in the author's home.
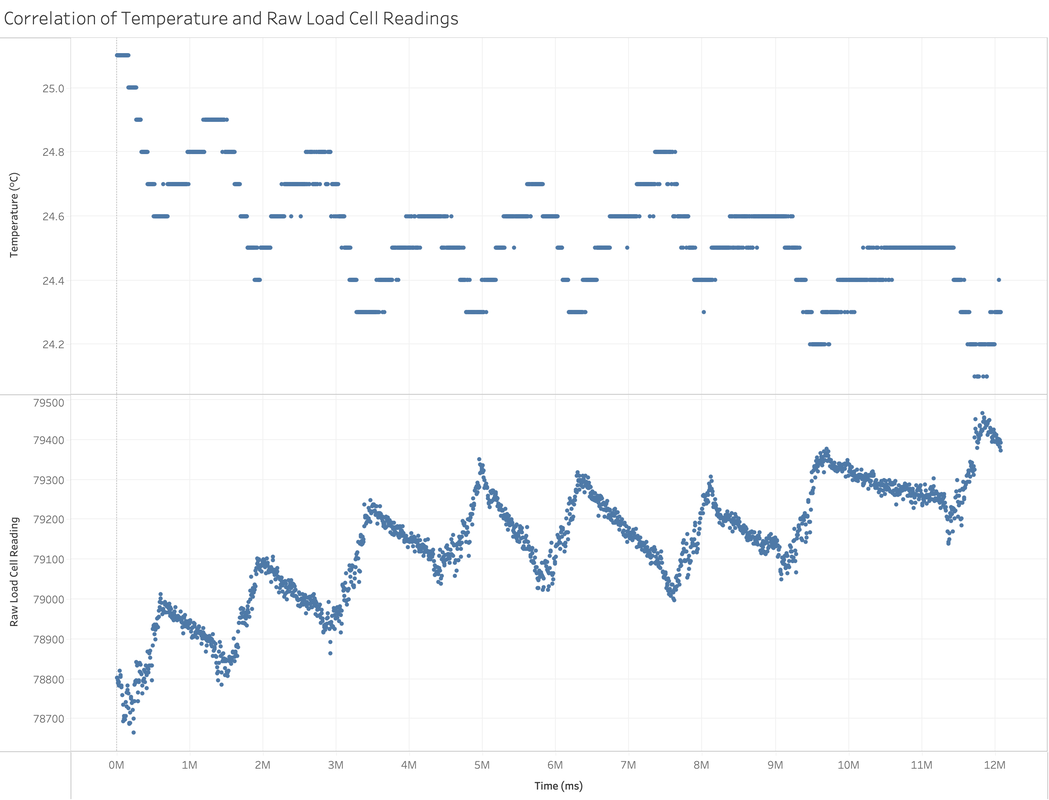
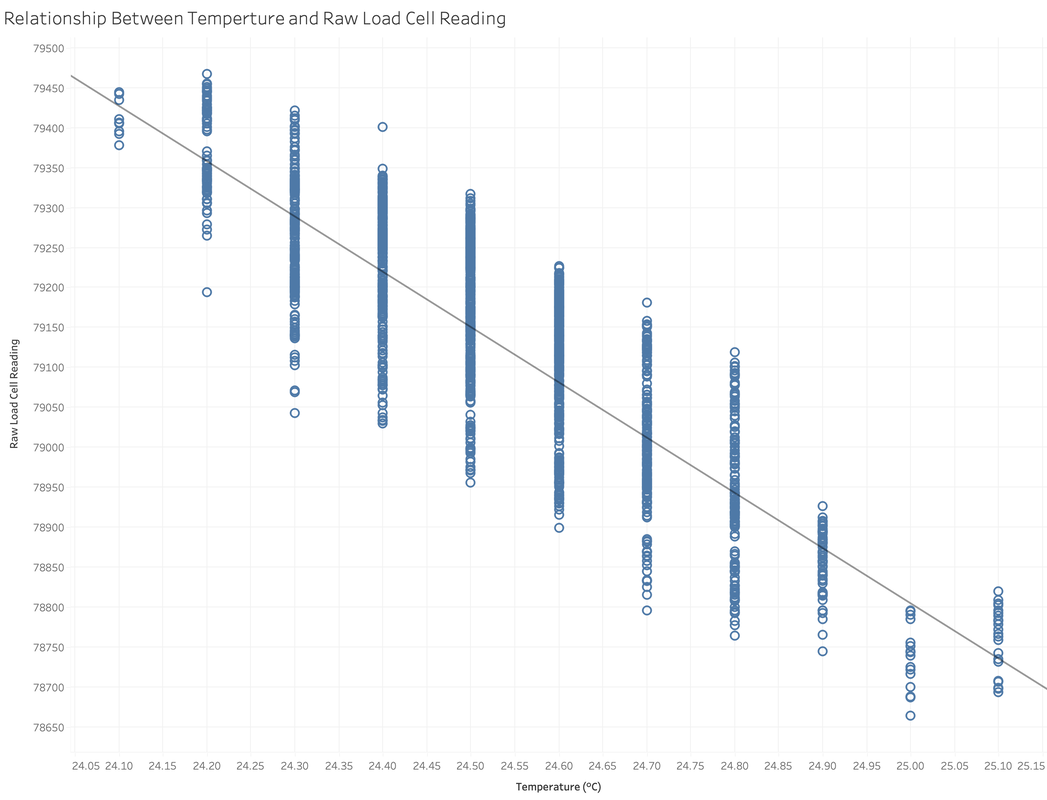
Using a regression line to map the relationship between temperature and the raw load cell readings, the following equation was developed to normalize the effect of temperature out of load cell readings:
normalizedLoadCellReading = rawLoadCellReading + 692.17 × temperature - 96108.6
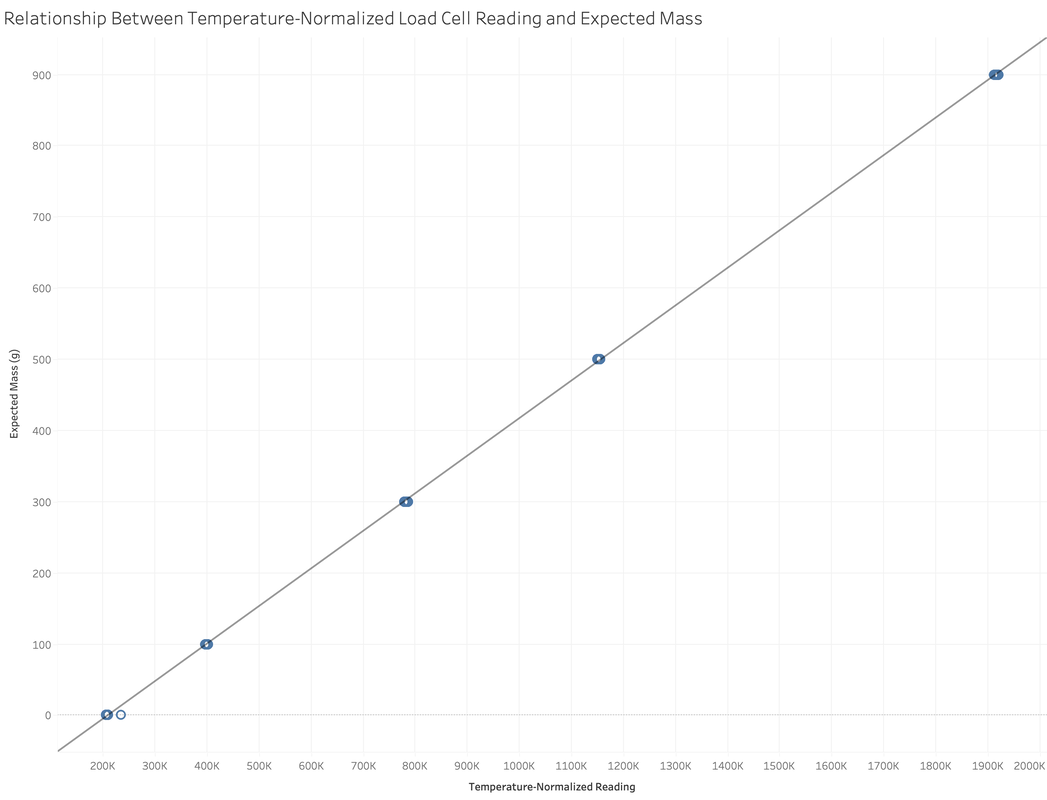
Once the load cell readings were normalized, deriving the coefficients for converting to grams was fairly straightforward:
massInGrams = 0.0005277 × normalizedLoadCellReading - 110.599
Tube Difficulties
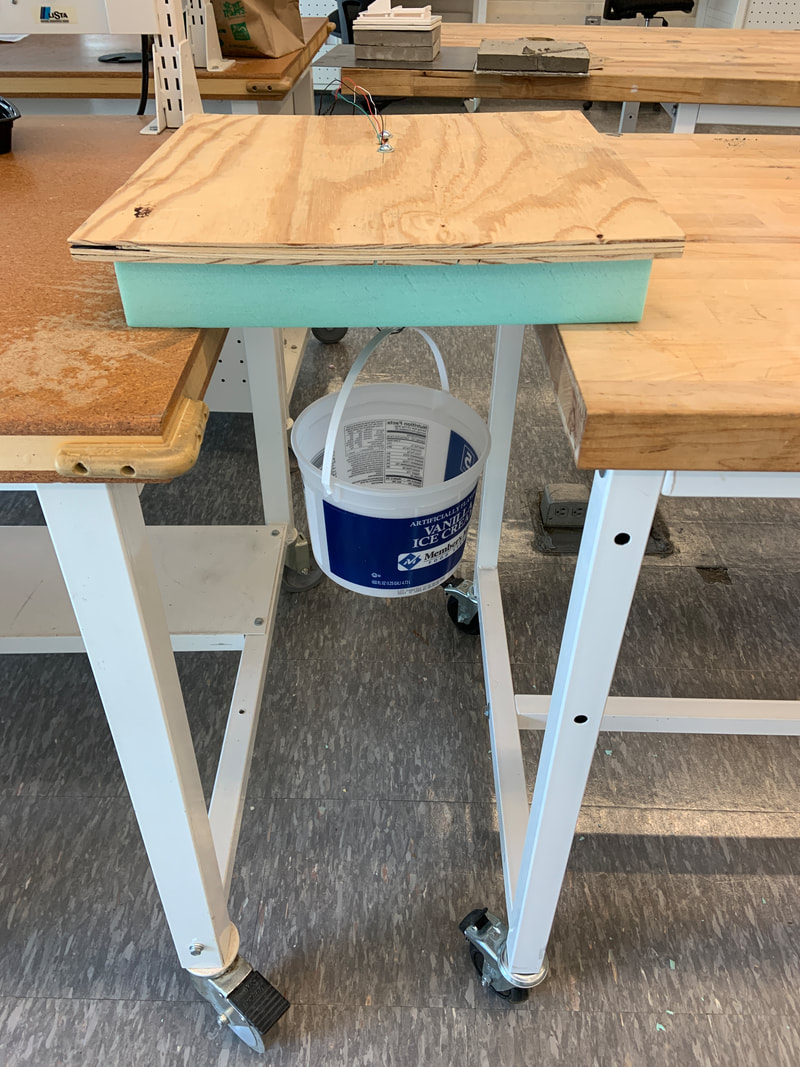
A flaw in the setup was discovered during the first attempted baseline test. Water vapor condensed on the sides of the plastic tube and collected in the bottom of the bend seen in the photo below. Eventually, the weight of that condensation caused the tube to bend, pinching off the flow of vapor into the enclosure. This problem was solved by using a shorter section of tube so that condensation would flow directly back into the humidifier.
|
|
Proposal |
Background |
Construction |
Methodology |
Results |