Data Visualization Workshop
Choose one of the datasets available on Canvas (Files > Workshops > datasets)
Open the file in excel and play with the graph-making tools. Bring the file into illustrator and manipulate some of the graphics. Post your final version here (this should be completed as a group and completed during class)
Open the file in excel and play with the graph-making tools. Bring the file into illustrator and manipulate some of the graphics. Post your final version here (this should be completed as a group and completed during class)
|
|
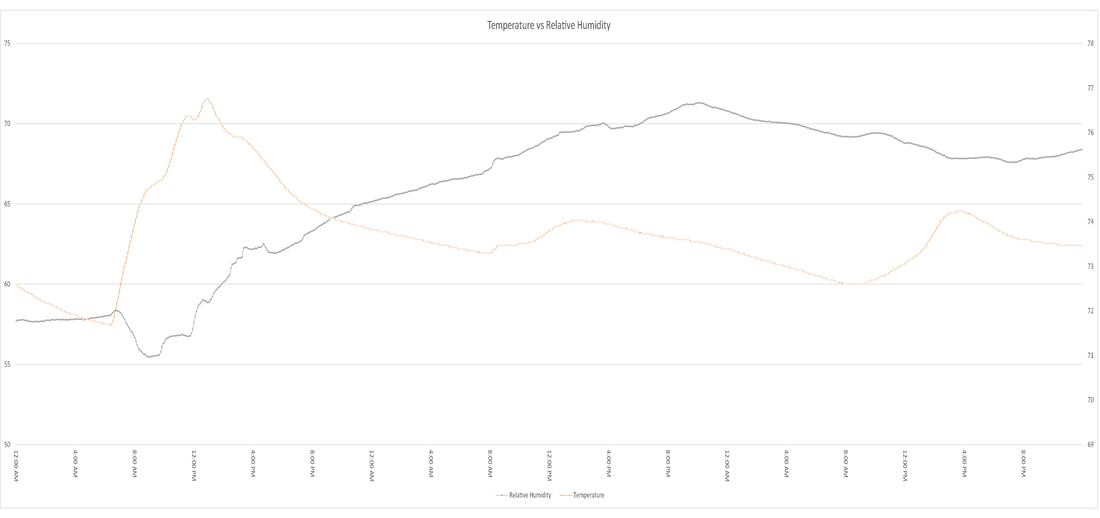
Callie, Ri, MichaelShort description of data (ie what are you trying to prove with this visualization?)
|

|
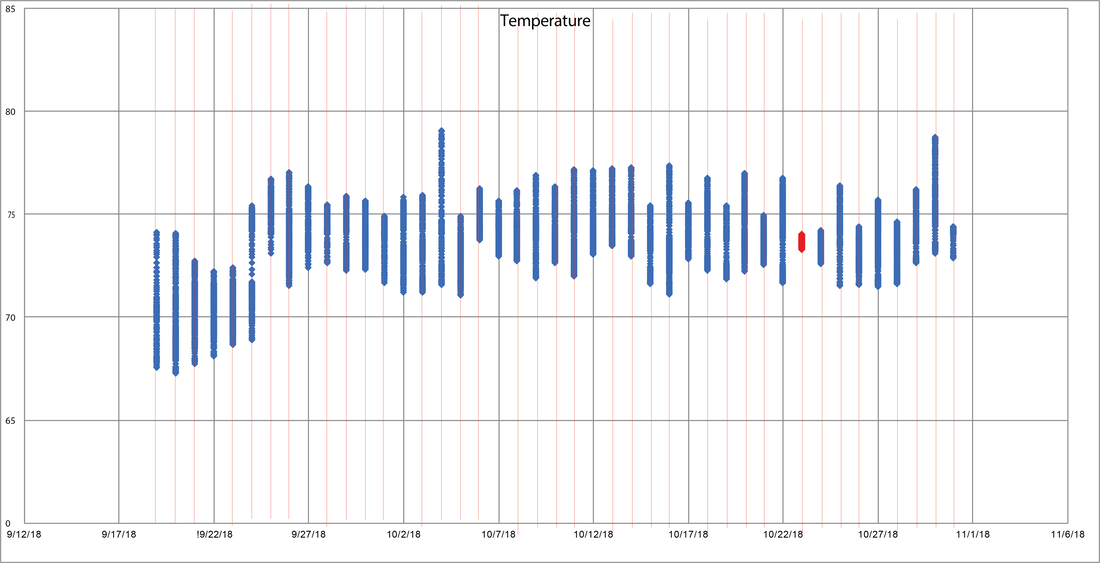
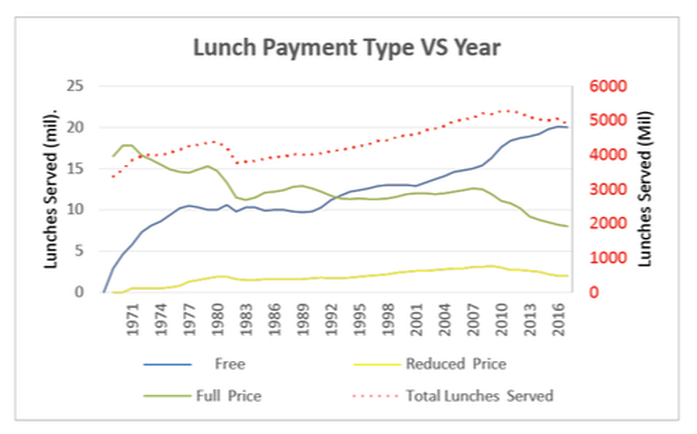
Alex, Luke, TommyShort description of data (ie what are you trying to prove with this visualization?)
|
|
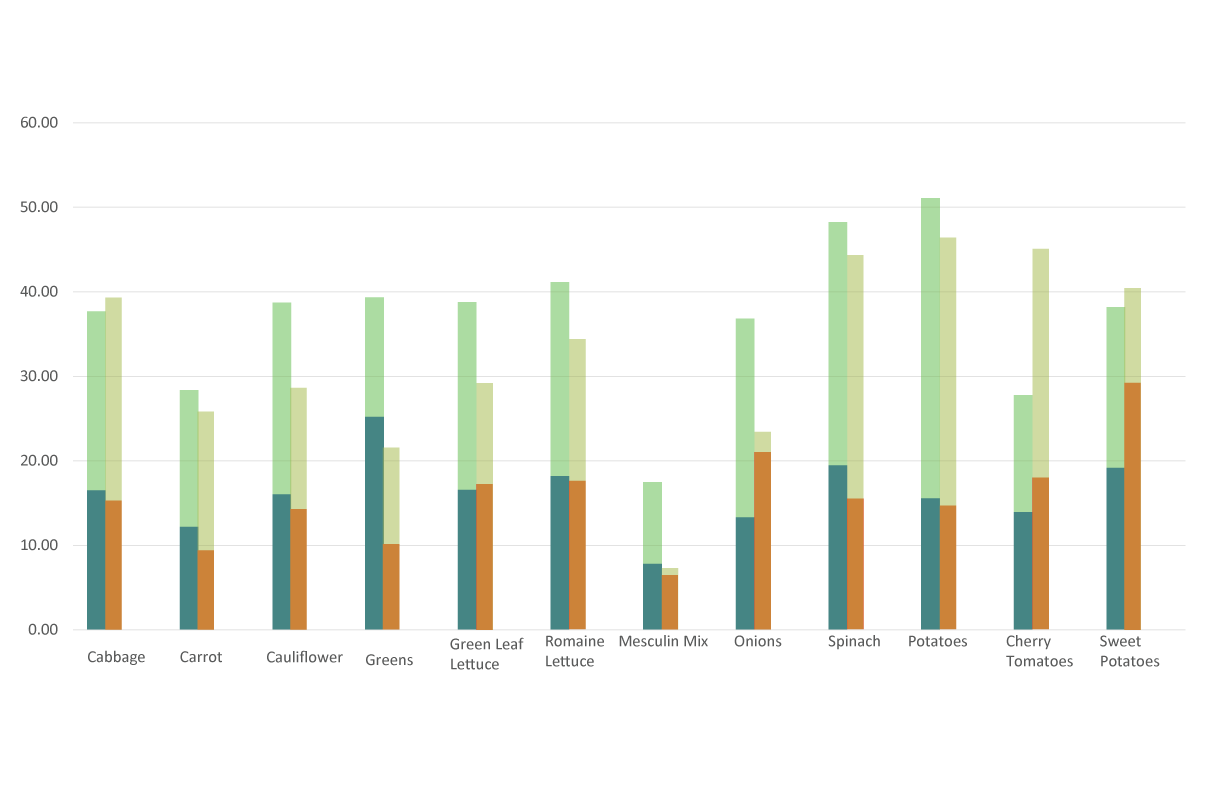
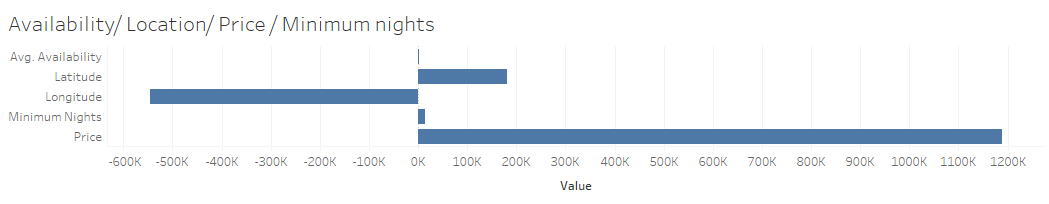
Jacob, Sandhya, Sam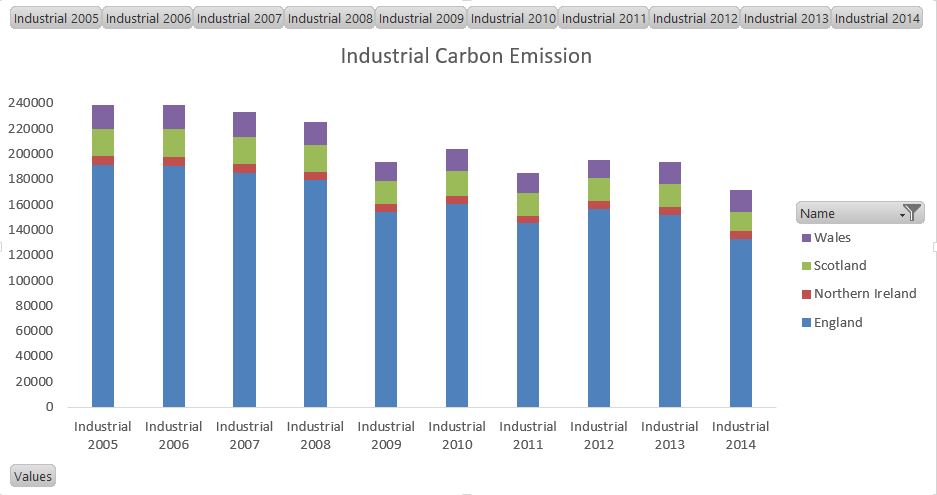
|
Archive
Visualization by Jesse, Sebastian, Aiden & Sage
Visualization by Aarati Podili