The Laws of Thermodynamics
|
As architects, we're particularly bound by the laws of thermodynamics. Heat transfers through our walls, through our floors and into our bodies, affecting the thermal comfort of the space and the overall energy use of the building. These laws define the fundamental qualities that define physical systems in buildings, chemical bonds, and the earths atmosphere. |
zeroth law
no heat will flow between any two bodies that are at the same temperature.
first law
energy cannot be created or destroyed (law of conservation of energy)
energy cannot be created or destroyed (law of conservation of energy)
second law
heat travels from hot to cold (energy travels from high to low)
heat travels from hot to cold (energy travels from high to low)
|
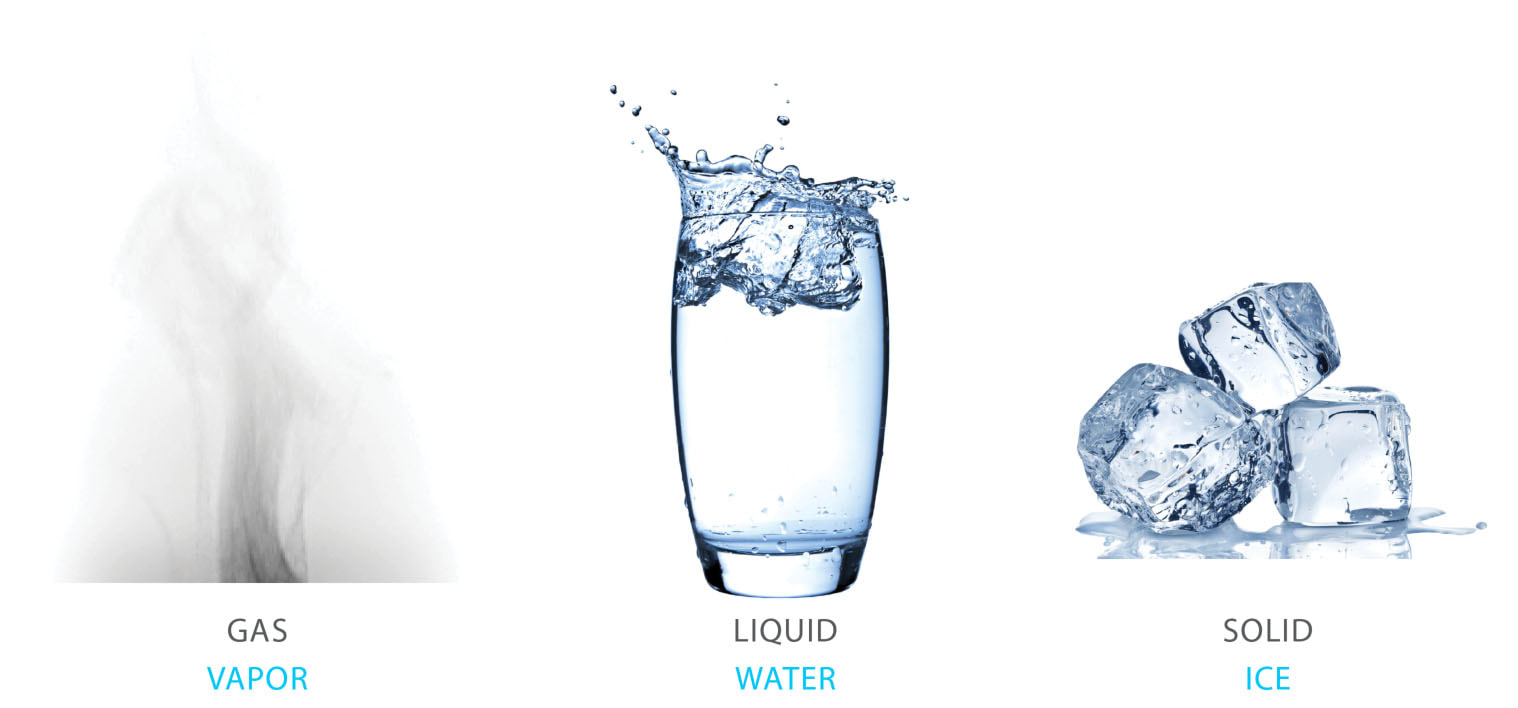
Matter is always seeking equilibrium. Moisture also moves from high to low, which defines the vapor profile in a building.
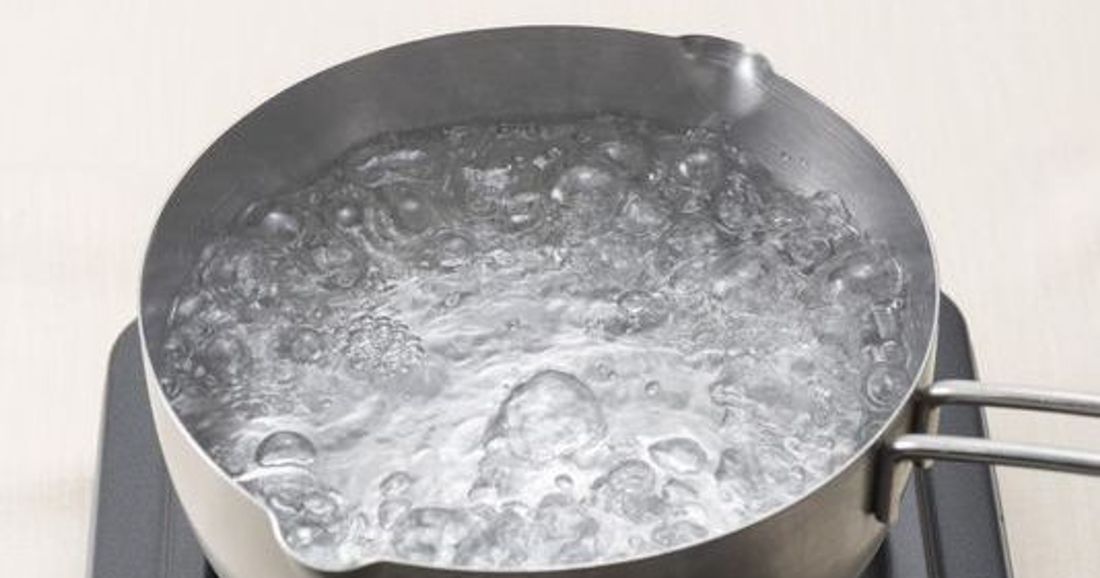
That being said, heat also moves from hottest to coldest. Take a boil pot of water, for example. When you drop spaghetti into the water, the water immediately stops boiling. It's not because the spaghetti cooled the water so much that it's below boiling temperature, it's because the heat of the stove immediately transfers to the coldest thing - the spaghetti. Once the noodles match the temperature of the water, only then will the pot continue to boil. |
third law
it is impossible to cool an object down to absolute zero (lowest possible temperature) because to do so it would require the presence of a still colder body
it is impossible to cool an object down to absolute zero (lowest possible temperature) because to do so it would require the presence of a still colder body
Heat Transfer

|
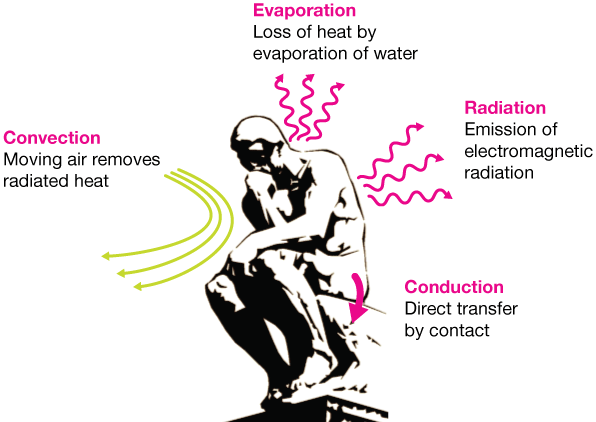
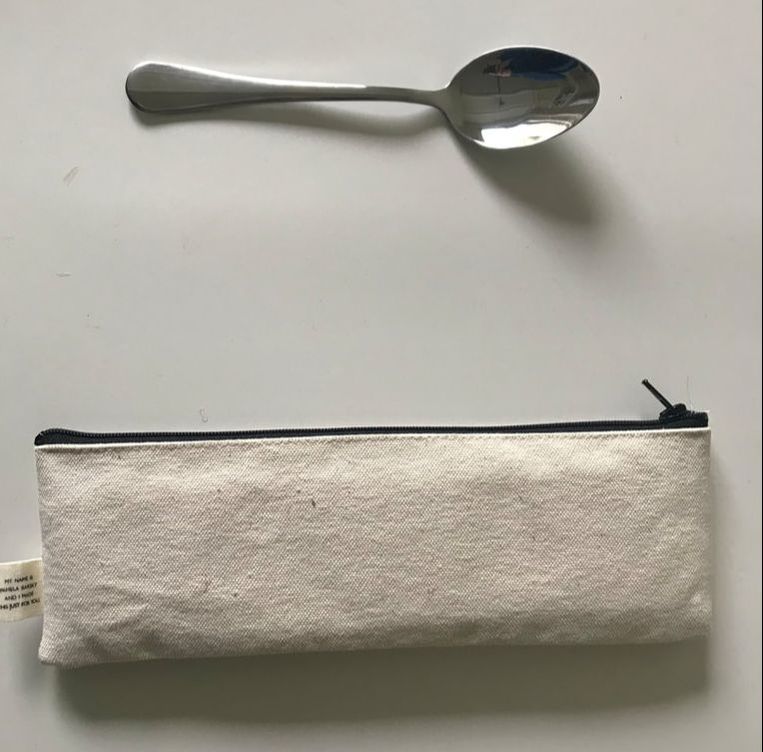
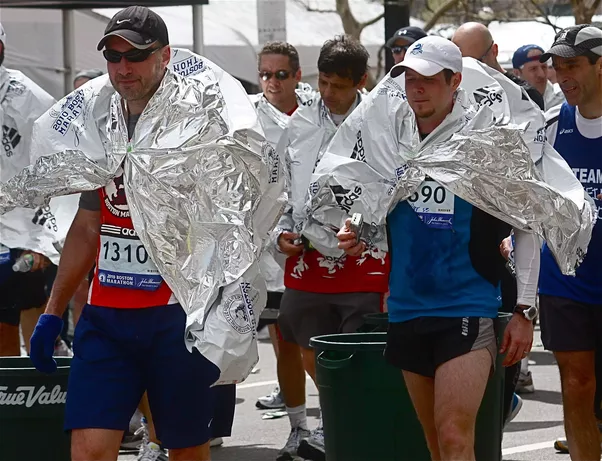
Convection The human body sweats. The transfer of moisture from inside to outside the body is most effective when air transfers that moisture away from your skin through convection. According to the laws above though, air will only transfer this moisture when the surrounding air is not fully saturated. That is why evaporative cooling works in a dry climate, but not in a humid climate - there's nowhere for that water to go! Conduction In class the other day, Shanelle picked up a stainless steel spoon in one hand and a canvas pencil bag in the other. She was asked to decide which item was colder. After a bit of deliberating, she decided that the spoon felt colder at first, but soon felt warmer. In fact, both the spoon and the pencil bag were the same temperature - room temperature. What Shanelle experienced was heat being transfered from her hand via conduction. Since the metal is more conductive than the canvas bag, it removes heat from her hand. In fact, we don't really comprehend heat until there is a temperature differential. Radiation Why do we give marathon runners metal blankets after they finish their race? A runners body will continue to emit heat (through radiation) and perspire (through evaporation) even hours after the race. The "blanket" serves to keep the runners heat close to their body even after the activity has stopped to prevent hypothermia. |
Material Properties
|
|
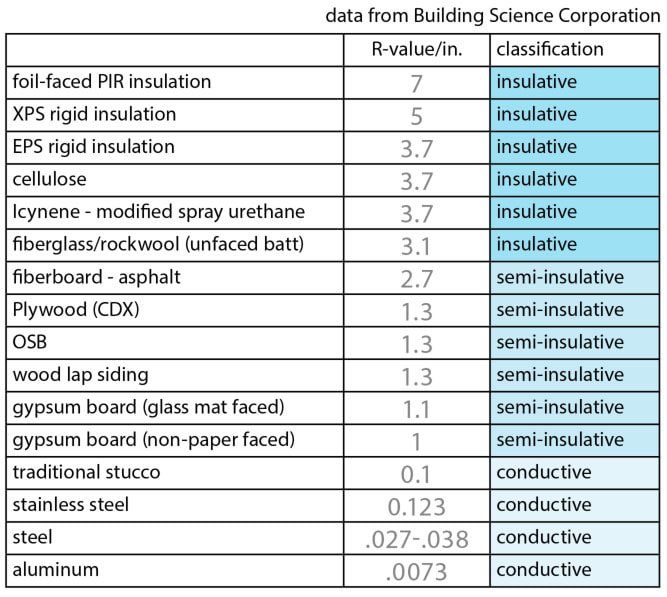
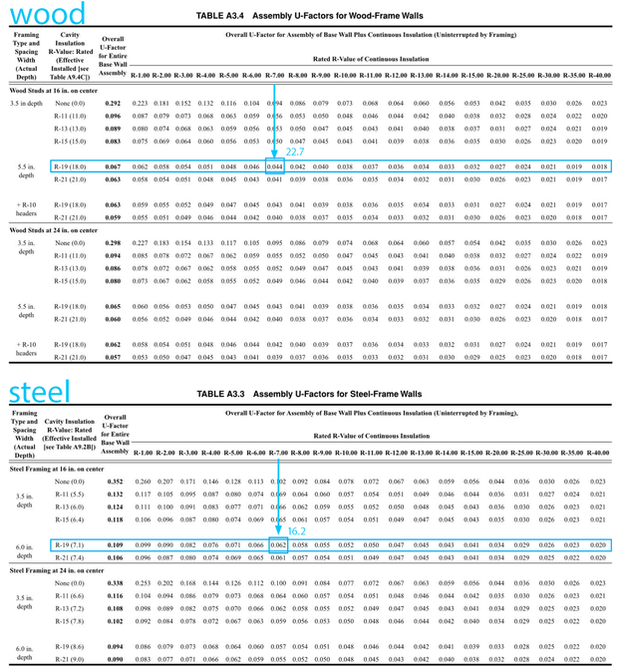
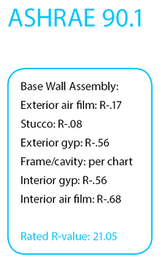
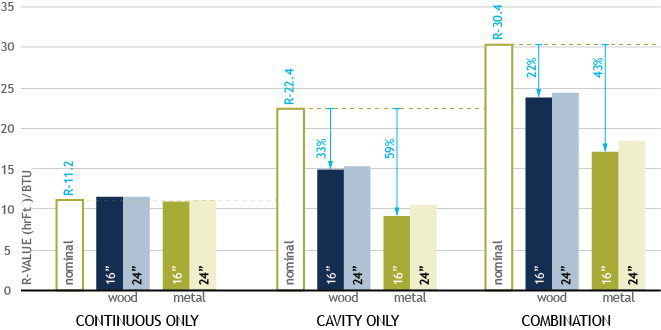
The R-value of a material is an indicator of its ability to resist or retard heat transfer in a given thickness of material. A high R-value is indicative of a insulative material (low conduction) while a low R-value indicates a more conductive material). In calculating the total R-value of a multi-layered assembly, the individual R-values are added together to form the nominal or rated R-value, essentially forming the best case scenario. Typical material R-values can be found in the ASHRAE Handbook of Fundamentals and a few of them can be found here (above left). When choosing insulation materials, it is also important to consider the embodied energy that goes into producing the materials.
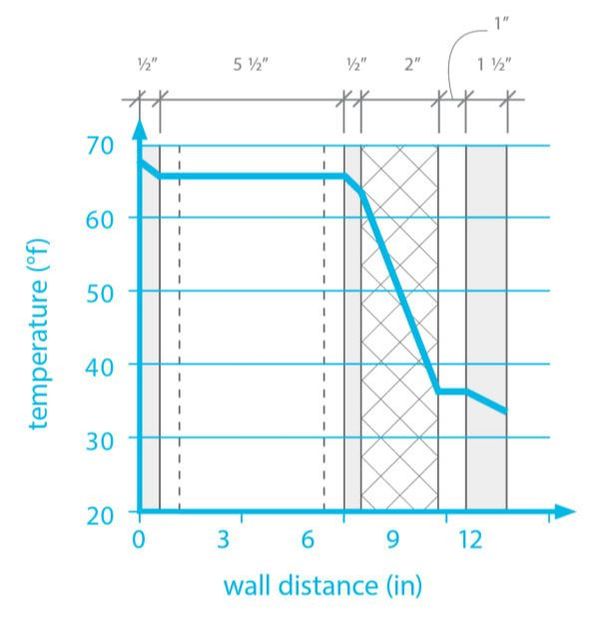
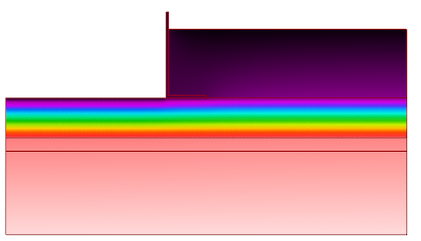
The graph above (right) shows the temperature gradient of a particular wall assembly during specific ambient conditions on either side of the wall. In this case, it is 70°F, 40% RH on the interior (left side) and 33°F, 75% RH on the exterior of the wall (right side). When a temperature differential exists between the two sides of the wall, heat will conduct from the warm side to the cold side. The slope of the gradient is proportional to the resistance (R-value) of the individual layers in the assembly. To calculate the basic thermal profile through the wall, follow these steps:
1. Find the temperature differential between inside and outside air (70°F-33°F = 37°F)
2. Add up the nominal thermal resistance (R) for the assembly, including the air films
(.74 + .45 + 0 + .45 + 8 + 1.2 + .23 = 11.1 (hrFt2 °F)/BTU) (U=.09 BTU/ (hrFt2 °F)
3. Calculate the temperature difference between each material. Divide the R-value of the material (Rmat) by the total nominal R-value (Rtot) and multiply by the temperature difference.
air film: (.74/11.1) x 37 = .76 (temp at interior surface of gypsum = 70-.76 = 69.24 °F
gypsum: (.45/11.1) x 37 = 1.5 (temp at exterior surface of gypsum = 69.24-1.5 = 67.74 °F
|
|
|
Thermal Qualities of Air
|
|
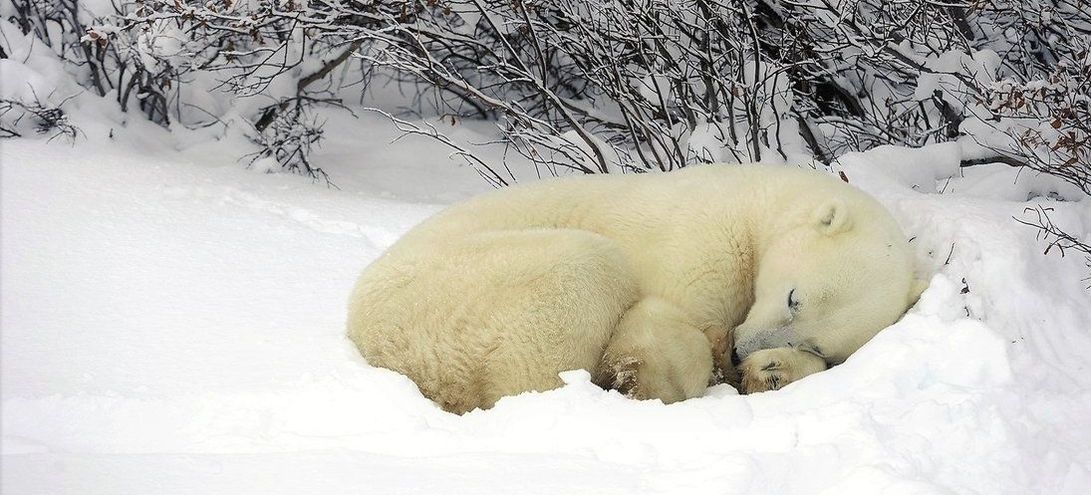
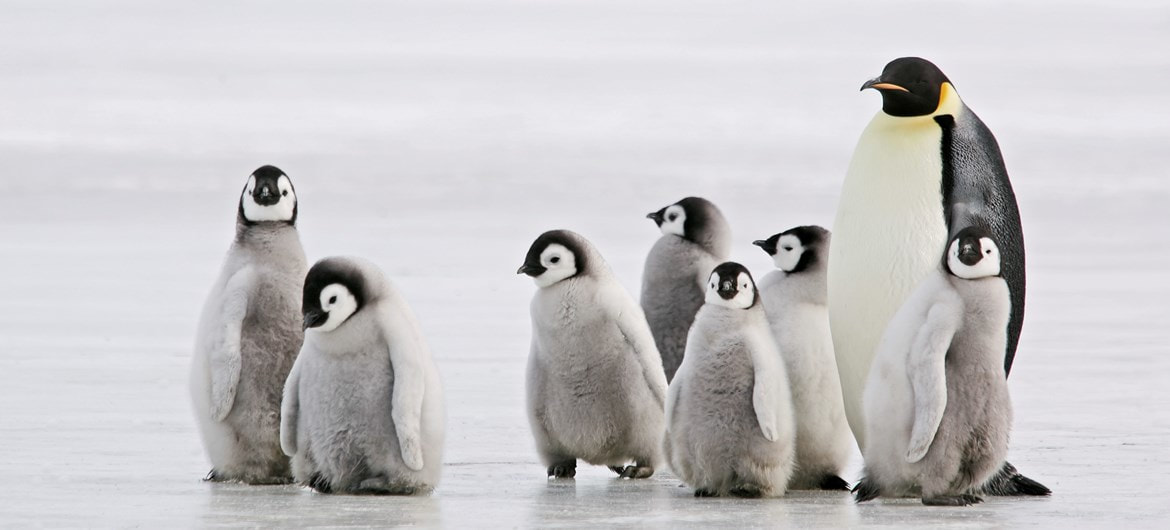
To retard the flow of heat: introduce voids or microscopic pockets of air. Air is a gas, and its atoms are spaced, on average, further apart than they are in solids. Air can act as an insulator — but only if it remains stagnant.
"Still air is the ‘gold standard’ for insulation in biology". (Craig 2017)
"Still air is the ‘gold standard’ for insulation in biology". (Craig 2017)
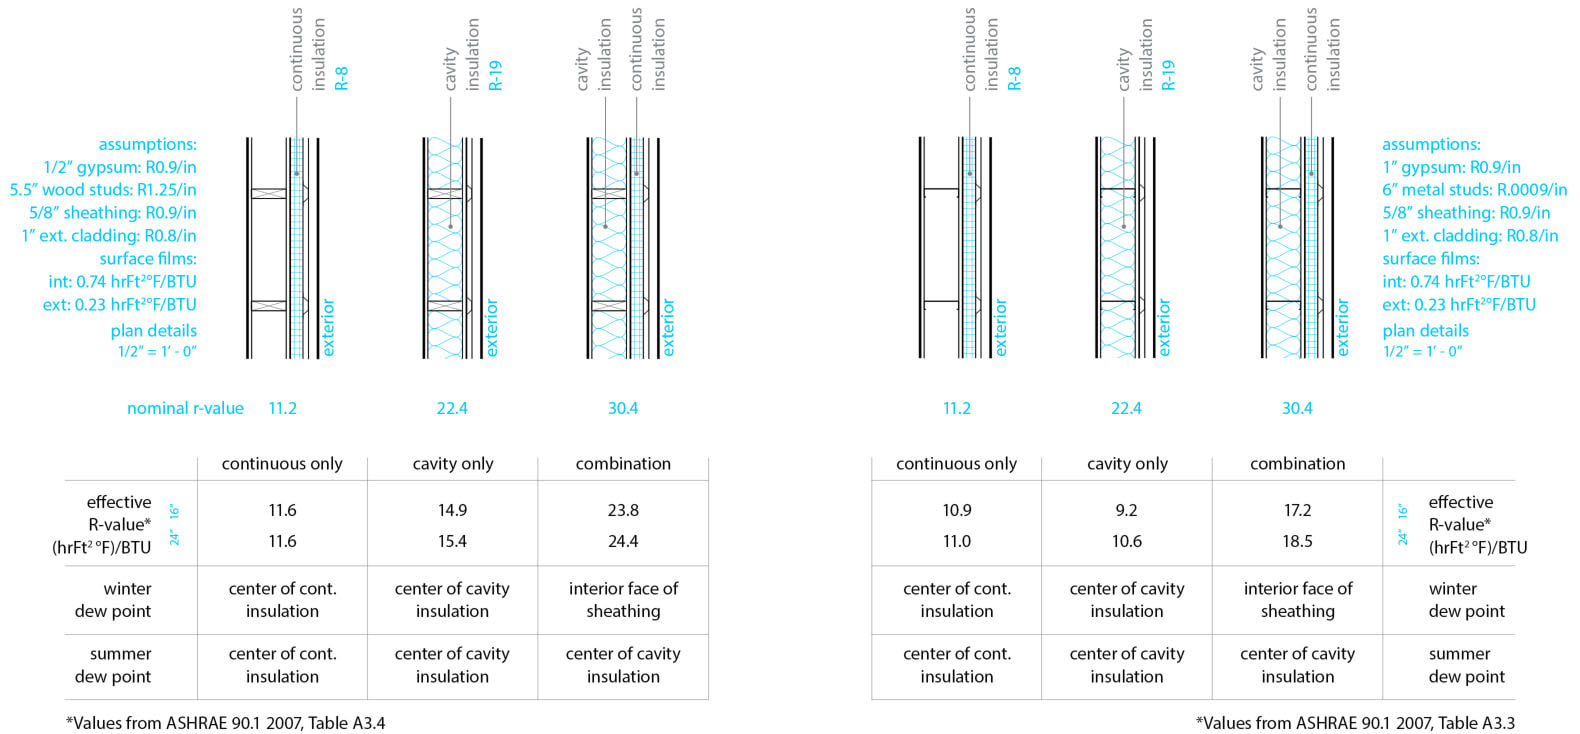
Thermal Bridging
What is a thermal bridge?... and why do I care?
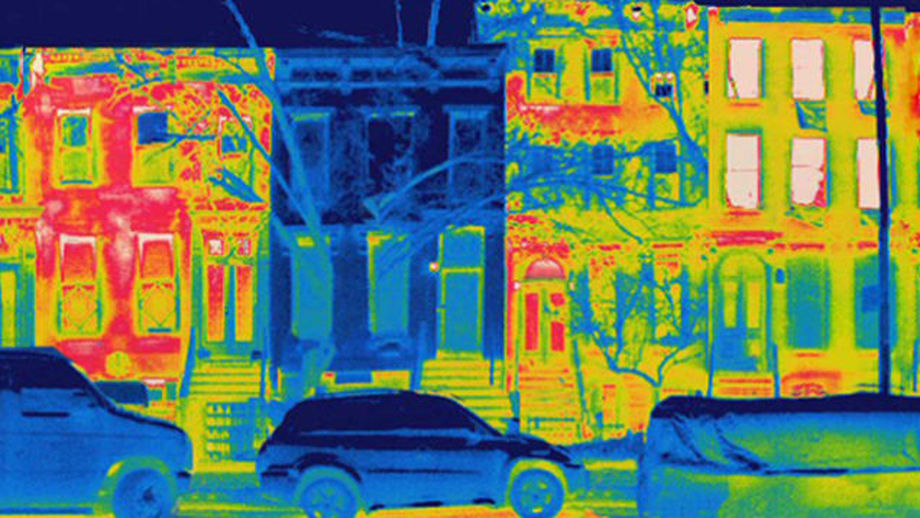
Thermal bridges can be defined as localized areas with higher thermal conductivity than the adjacent areas. This can also come from penetrations through the assembly, attachments of exterior finish materials, doors and windows, ducts and many other components of the construction process.
Thermal bridges can be defined as localized areas with higher thermal conductivity than the adjacent areas. This can also come from penetrations through the assembly, attachments of exterior finish materials, doors and windows, ducts and many other components of the construction process.
|
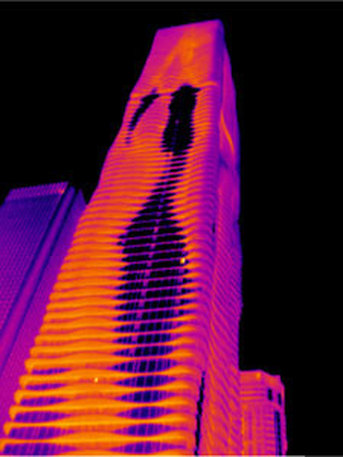
The thermal image shown here is Jeanne Gang's Aqua Tower in Chicago, IL, which has become the poster child for thermal bridging. Here, the concrete slabs are extended beyond the thermal envelope (largely glass), transferring a huge amount of energy between inside and out.
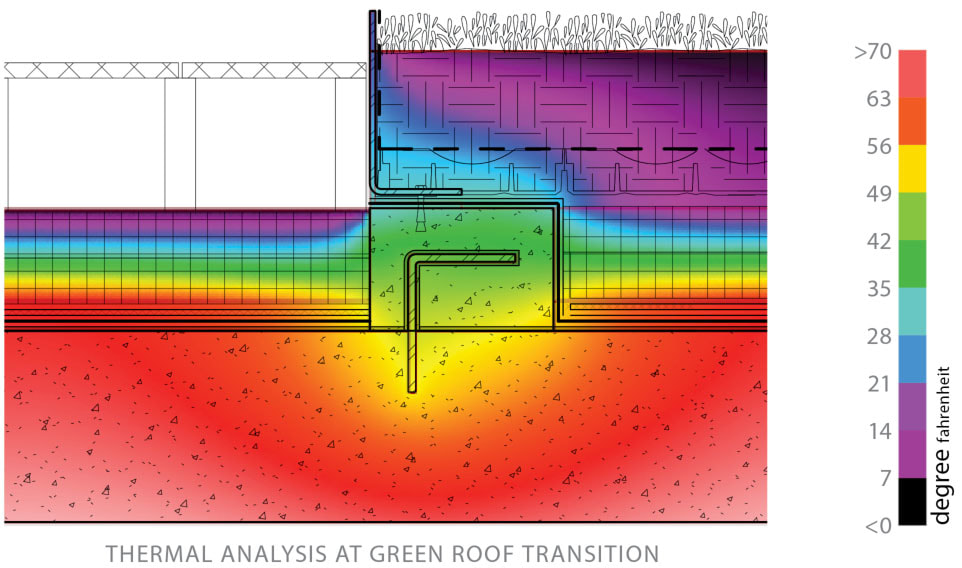
Thermal heat transfer can be easily calculated at the one-dimensional scale, however this method does not account for thermal interactions between systems, such as between windows and walls. Two-dimensional thermal modeling tools, such as Lawrence Berkeley National Lab’s (LBNL) Therm, are used to digitally simulate heat transfer through building assemblies. This is helpful to identify thermal bridges or locate the dew point within the assembly. With this information, the designer can determine where to locate thermal breaks, add insulation, or even feed the results into an energy model for more accurate results. Here are some of the ways that this one phenomenon can impact the performance of a building: |
Occupant Comfort
These conditions can create cold or hot spots within an assembly that may radiate to the interior space, creating opportunities for occupant discomfort.
Moisture Impact - mold, health, material failure
Extreme temperature differentials within an otherwise uniform assemebly create prime opportunities for condensation to form when the material temperature is below the dewpoint of the air. This can lead to mold if the material is not able to dry thoroughly or material failure if the material is not able to tolerate moist conditions.
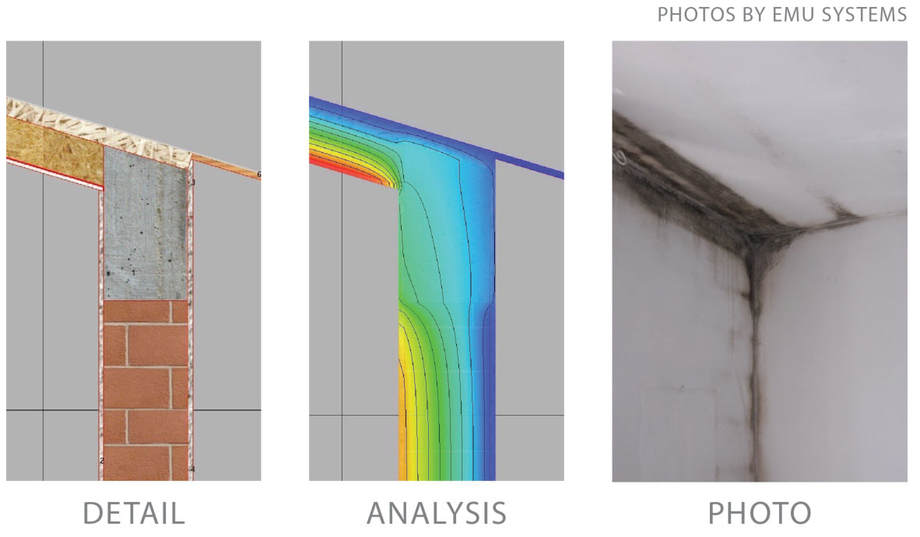
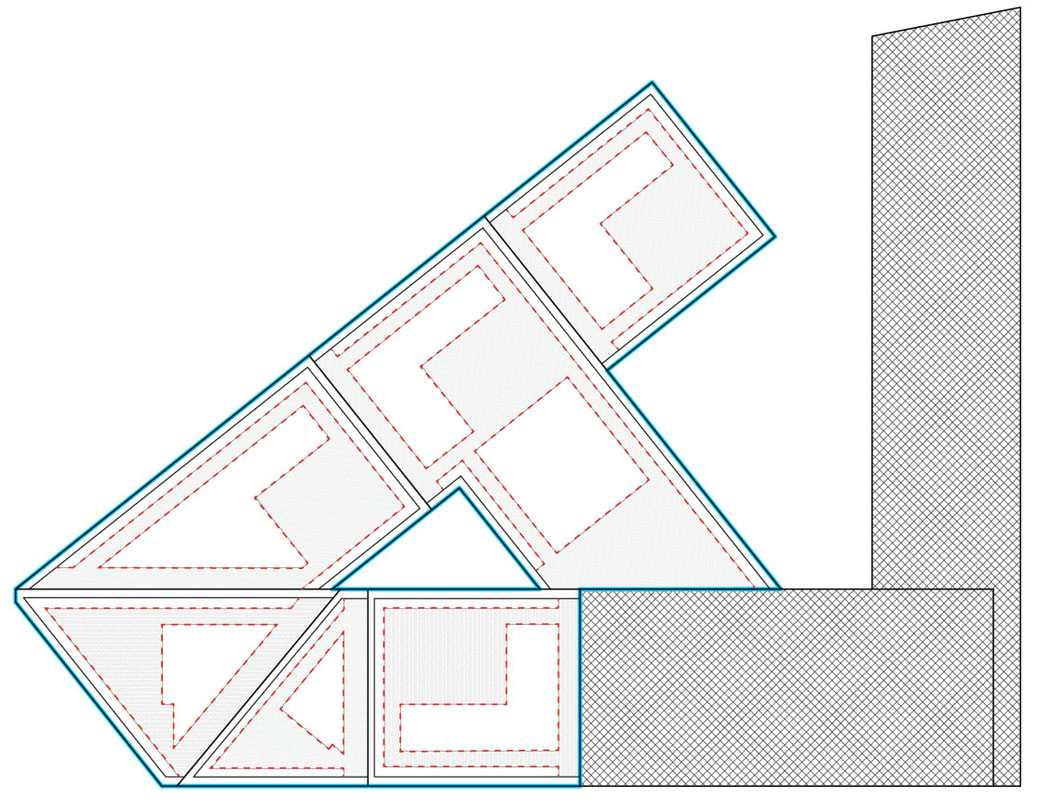
The project shown here, located in Italy, had a significant condensation problem along the perimeter concrete beam at the intersection of the wall and roof in the attic. Though this is not a conventional detail seen in the US, the concrete beam was more conductive than the brick masonry, so a thermal bridge was created. The concrete beam was required for seismic purposes.
Not only did the thermal bridge likely increase mechanical conditioning demands, it created a cold spot which impacted the thermal comfort within the space. Additionally, the lower internal temperatures allowed condensation to form and the sustained conditions (and lack of drying) permitted mold to form. Though thermal bridging does not always lead to interior mold issues, it is most common in buildings that are not properly ventilated (Bonilauri 2016).
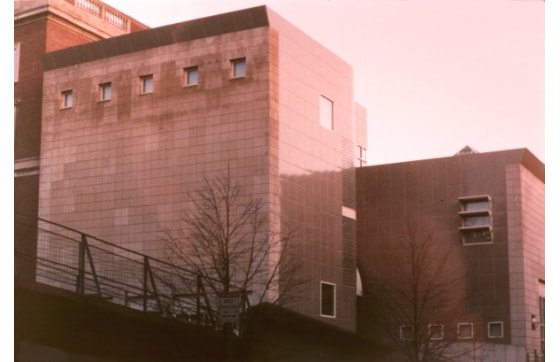
The Werner Otto Hall at the Busch Reisinger Museum located at Harvard University, shown below, is a token example of building failure due to poor detailing, particularly poor air sealing and thermal bridging. In fact, the building only lasted 19 years – it was constructed in 1991 and demolished in 1991.
Not only did the thermal bridge likely increase mechanical conditioning demands, it created a cold spot which impacted the thermal comfort within the space. Additionally, the lower internal temperatures allowed condensation to form and the sustained conditions (and lack of drying) permitted mold to form. Though thermal bridging does not always lead to interior mold issues, it is most common in buildings that are not properly ventilated (Bonilauri 2016).
The Werner Otto Hall at the Busch Reisinger Museum located at Harvard University, shown below, is a token example of building failure due to poor detailing, particularly poor air sealing and thermal bridging. In fact, the building only lasted 19 years – it was constructed in 1991 and demolished in 1991.
|
|
The curators of the museum required that the interior air be kept at 70F and 50% RH to maintain the health of the artwork. In addition, the building was pressurized so that air would only leak out, and never in from outside. Over time, cold, moist air leaked into the cavity during winter months and condensed. During the cold Boston winter, the condensation coming from the humid interior air would sometimes freeze.
Adding to the problem, the exterior metal panels were connected to the framing with galvanized ties which rusted and deteriorated. Had the ties been stainless steel, though more expensive, the attachments would have been less susceptible to damage from moisture. Over time, the panels began to fall off the building and onto the sidewalk.Even beore that, there were other visible symptoms that began to appear. There was moisture accumulating in the roof, icicles along the bottom of the parapet, wet stains on the limestone façade, rust spots along the metal wall panels and staining from the glass block windows. Upon first trying to diagnose the problem, the first thought was that the air and vapor barrier had been punctured, potentially by the curators when trying to hang the art. The museum hired Simpson Gumpertz & Heger (SGH) to investigate the problem.
According to their website, SGH performed the following services:
o Investigated the building’s moisture migration problems and leakage of waterproofing
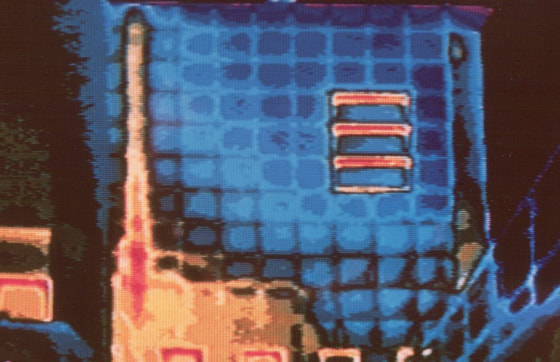
o Performed infrared scanning of the building exterior to identify heat flow
o Measured air pressure between interior building areas, wall cavities, and the exterior
o Made observations of concealed conditions at exploratory openings
o Water tested to determine leakage paths
o Designed plans and specifications for plaza waterproofing repairs
Due to numerous lawsuits, the official cause of damage was never released.
Adding to the problem, the exterior metal panels were connected to the framing with galvanized ties which rusted and deteriorated. Had the ties been stainless steel, though more expensive, the attachments would have been less susceptible to damage from moisture. Over time, the panels began to fall off the building and onto the sidewalk.Even beore that, there were other visible symptoms that began to appear. There was moisture accumulating in the roof, icicles along the bottom of the parapet, wet stains on the limestone façade, rust spots along the metal wall panels and staining from the glass block windows. Upon first trying to diagnose the problem, the first thought was that the air and vapor barrier had been punctured, potentially by the curators when trying to hang the art. The museum hired Simpson Gumpertz & Heger (SGH) to investigate the problem.
According to their website, SGH performed the following services:
o Investigated the building’s moisture migration problems and leakage of waterproofing
o Performed infrared scanning of the building exterior to identify heat flow
o Measured air pressure between interior building areas, wall cavities, and the exterior
o Made observations of concealed conditions at exploratory openings
o Water tested to determine leakage paths
o Designed plans and specifications for plaza waterproofing repairs
Due to numerous lawsuits, the official cause of damage was never released.
Energy Impact
The bridge reduces the overall performance of the assembly, meaning more heat will flow across that layer. This reduces the amount of resistivity to the temperature differential between inside and out, creating potentially higher heating and cooling demands to maintain the design conditions within the building (as well as noncompliance with energy codes).
The bridge reduces the overall performance of the assembly, meaning more heat will flow across that layer. This reduces the amount of resistivity to the temperature differential between inside and out, creating potentially higher heating and cooling demands to maintain the design conditions within the building (as well as noncompliance with energy codes).

|
|
|
|
|
Thermally Broken Condition
U = .031 R = 33.6 CHARLOTTESVILLE HEATING LOAD: 62,500 KBTU COOLING LOAD: 21,500 KBTU |
Thermal Bridge Condition
U=.101 R = 9.9 CHARLOTTESVILLE HEATING LOAD: 88,000 KBTU (+25,500) COOLING LOAD: 30,500 KBTU (+9,000) |
Moisture Basics
|
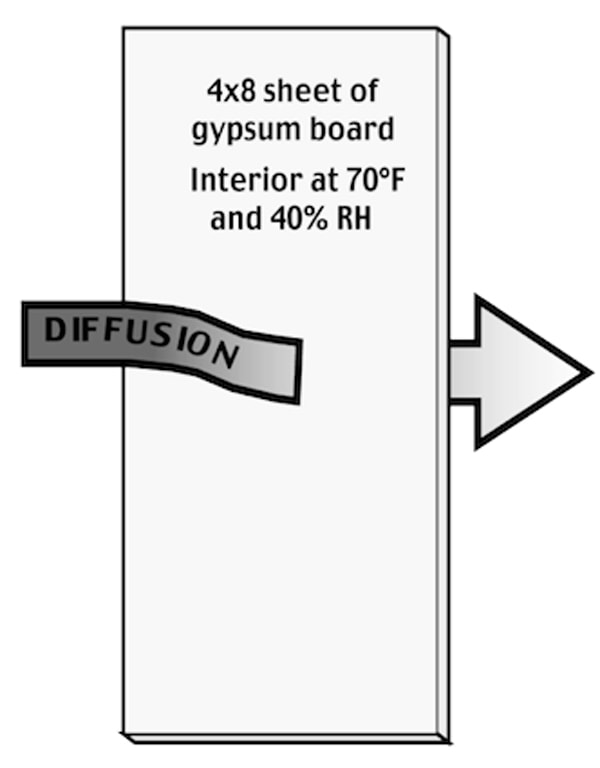
Vapor diffusion The movement of water vapor through vapor permeable materials Bulk flow Intrusion from rain water and/or leaks Infiltration/exfiltration Unintentional introduction of outside air into a building (typically through cracks and doors/windows) |
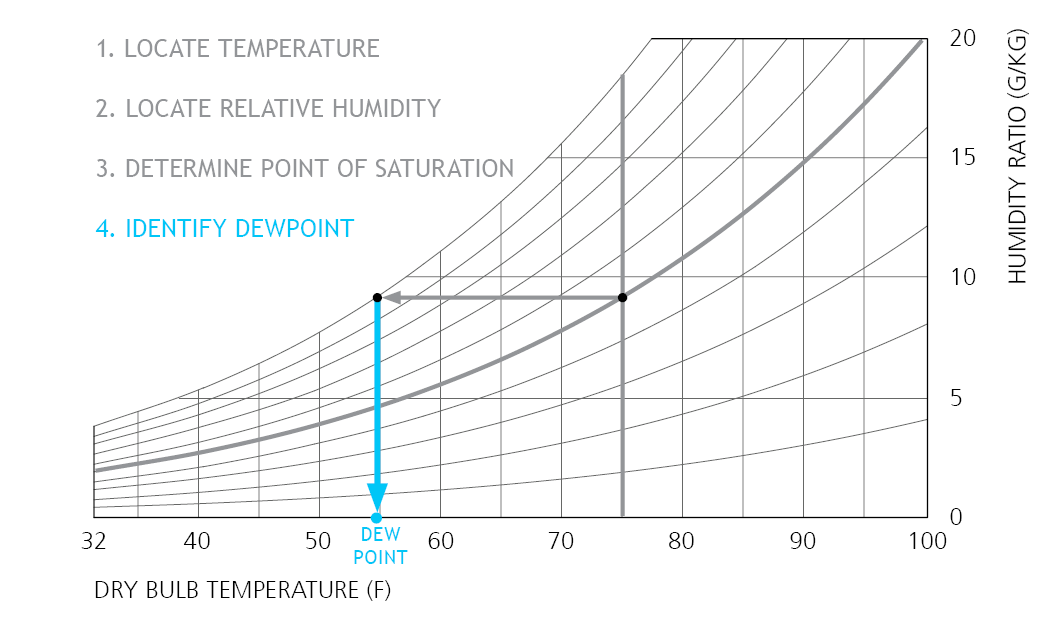
Using the Psychrometric Chart
The psychrometric chart is a useful tool to demonstrate the relationship between heat and moisture, providing key benchmarks for successful thermal and hygrothermal management. When designing wall assemblies, the chart is particularly useful in determining the dew point of specific conditions - a useful metric to evaluate and manage moisture - the temperature at which air becomes fully saturated and liquid water forms (condensation).
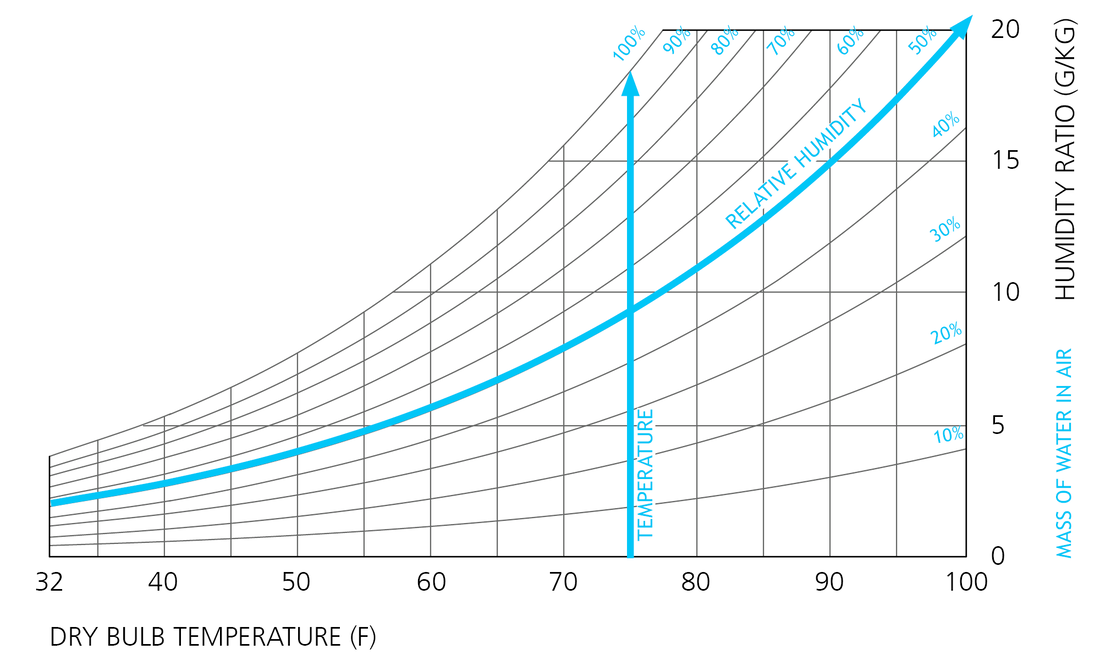
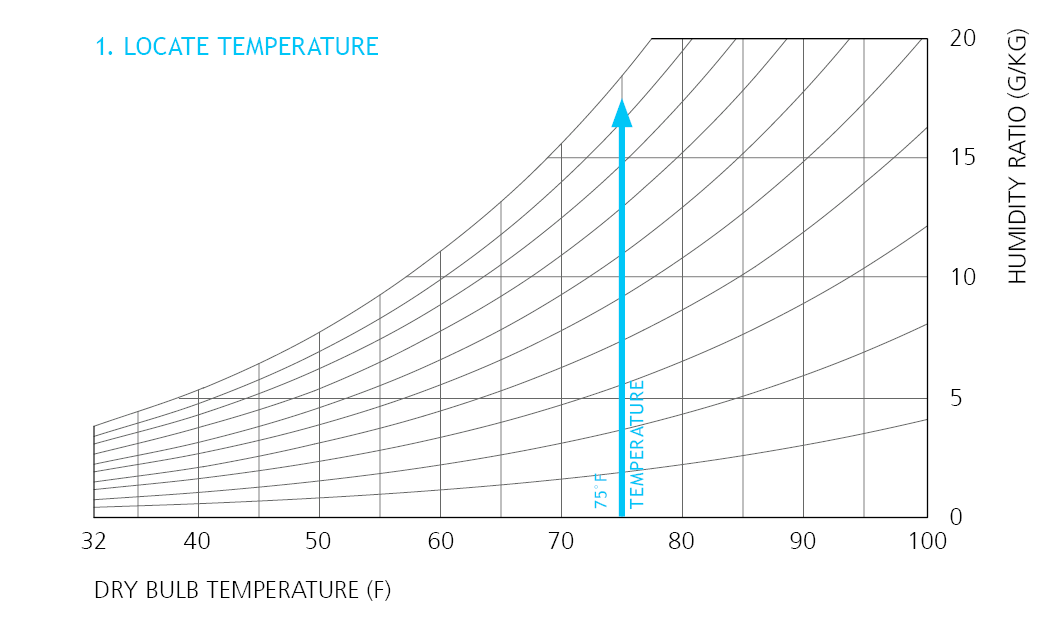
The following instructions demonstrate how to calculate the dew point using the psychrometric chart. Next we will find the location of the dew point for 75F, 50% RH air.
|
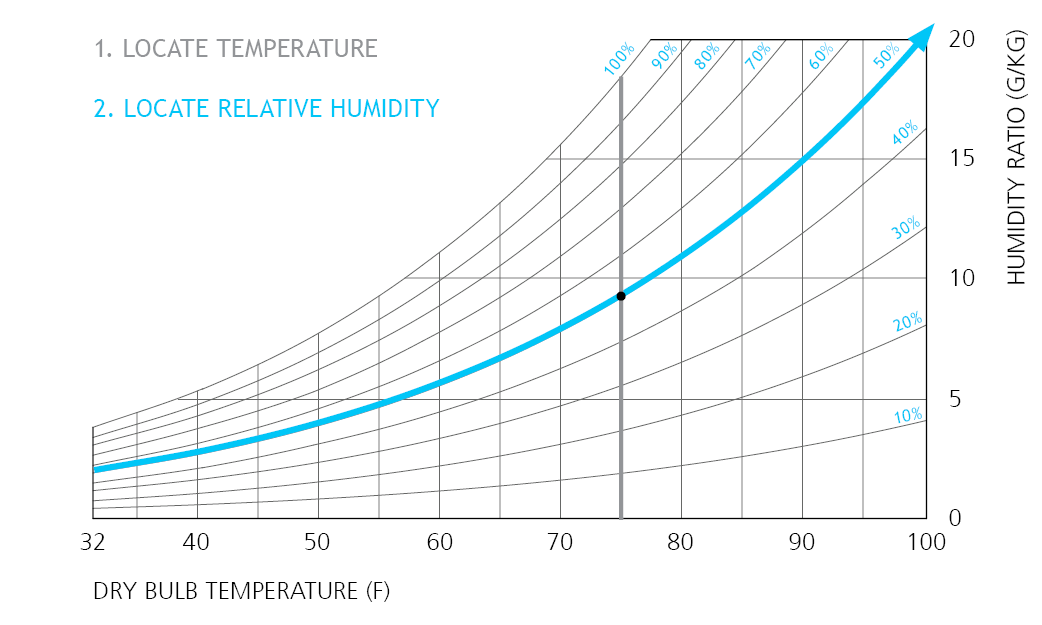
Locate Temperature The horizontal-axis shows dry bulb temperature (the temperature of air measured by a thermometer that is freely exposed to the air, but shielded from radiation and moisture). 75°F is shown here. Locate Relative Humidity The vertical-axis shows the humidity ratio or moisture content (typically in g(water) / kg(dry air). The curved lines through the chart represent the relative humidity (%). Using only temperature and RH, you can then locate the point. 50% RH is shown here.
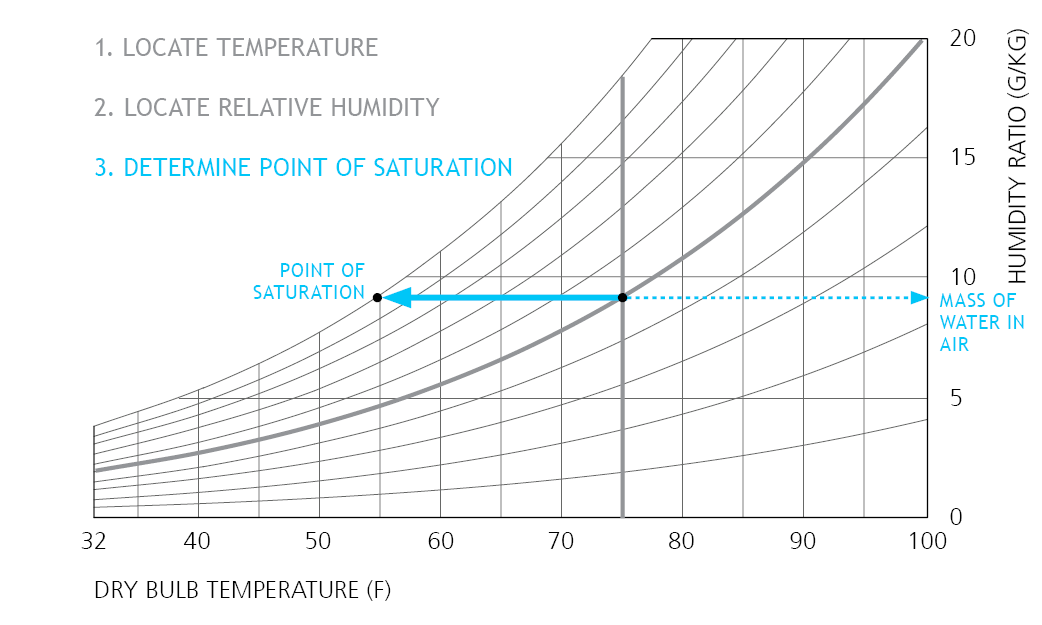
Point of Saturation Move leftward in a straight line from any coordinate (combination of temperature and relative humidity) to reach the saturation curve. Without changing the amount of moisture in the air, you're determining the temperature at which the air becomes completely saturated (the dew point). By moving along the horizontal axis, the mass of water vapor is held constant, but you move towards the 100% RH line. If you move across the horizontal to the right side of the graph, you'll reach the humidity ratio, or the mass of water in air in g(water)/kg(air). This is the absolute amount of water in the air, regardless of temperature. Dew Point Once you reach the point of saturation (at 100% RH), draw a line straight down back to the temperature axis to find the dew point. Here we see that the dew point for 75°F, 50% RH air is approximately 55°F. |
Sources:
Craig, Salmaan. 2017. “Some Things You Should Know about Heat.” Thermal Tectonics for the Next Billion People, February. https://www.pubpub.org/pub/5882929e97391e003a7fd0e2.
Miro board link from Week 2 workshop (convection/conduction/radiation):
https://miro.com/app/board/uXjVOUuJ178=/
Craig, Salmaan. 2017. “Some Things You Should Know about Heat.” Thermal Tectonics for the Next Billion People, February. https://www.pubpub.org/pub/5882929e97391e003a7fd0e2.
Miro board link from Week 2 workshop (convection/conduction/radiation):
https://miro.com/app/board/uXjVOUuJ178=/