meth·od·ol·o·gy
a system of methods used in a particular area of study or activity.
Methodology is the "systematic, theoretical analysis of the methods applied to a field of study. It comprises the theoretical analysis of the body of methods and principles associated with a branch of knowledge. Typically it encompasses concepts such as paradigm, theoretical model, phases and quantitative or qualitative techniques" (Wiki)
You probably learned about the scientific method in high school, and maybe even wrote a paper or two using its format. We'll be using the scientific method in this class because it is set up to explore observations (results) and answer questions (your hypothesis). This writing style is can be adapted as needed - "in fact, there are probably as many versions of the scientific method as there are scientists! But even when modified, the goal remains the same: to discover the cause and effect relationship by asking questions, carefully gathering and examining the evidence, and seeing if all the available information can be combined in to a logical answer" (sciencebuddies.org).
You probably learned about the scientific method in high school, and maybe even wrote a paper or two using its format. We'll be using the scientific method in this class because it is set up to explore observations (results) and answer questions (your hypothesis). This writing style is can be adapted as needed - "in fact, there are probably as many versions of the scientific method as there are scientists! But even when modified, the goal remains the same: to discover the cause and effect relationship by asking questions, carefully gathering and examining the evidence, and seeing if all the available information can be combined in to a logical answer" (sciencebuddies.org).
|
|
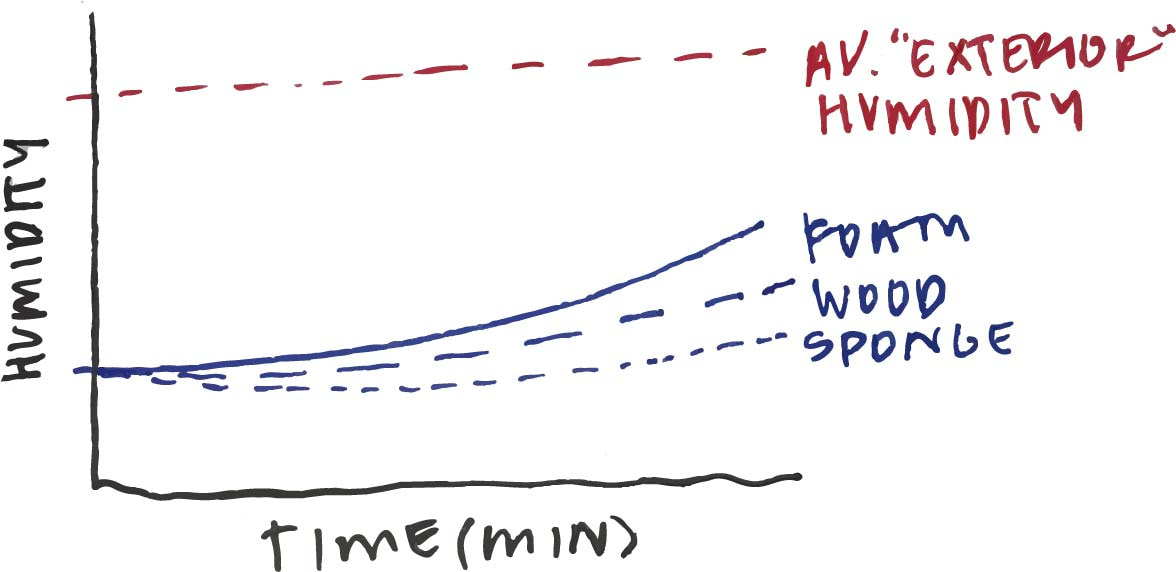
A well researched hypothesis will help you to make an informed prediction. I find it helpful to visualize your hypothesis - what do you think is going to happen during the course of your experiment? Sketch out your anticipated results (as below), but don't try to anticipate numbers - just try to represent the phenomena that you expect to experience. This process is helpful to generate your testing methods and procedures.
|
Test your hypothesis - experiment, iterate, repeat! The experiment is a crucial part of this methodology, but needs to be tightly regulated: •Establish a control •Define a clear methodology •Establish a procedure for recording results |
The control is a crucial factor in your experimental process - it's the basis by which everything is compared and helps you identify the variables and the causal relationships between them. In the context of this class, it may be helpful to test your experiment against established (published) data. Be sure to address the following questions:
•What are you going to measure?
•How are you going to measure it
•How are you going to get consistent results?
Some other factors that might need control:
•What are you going to measure?
•How are you going to measure it
•How are you going to get consistent results?
Some other factors that might need control:
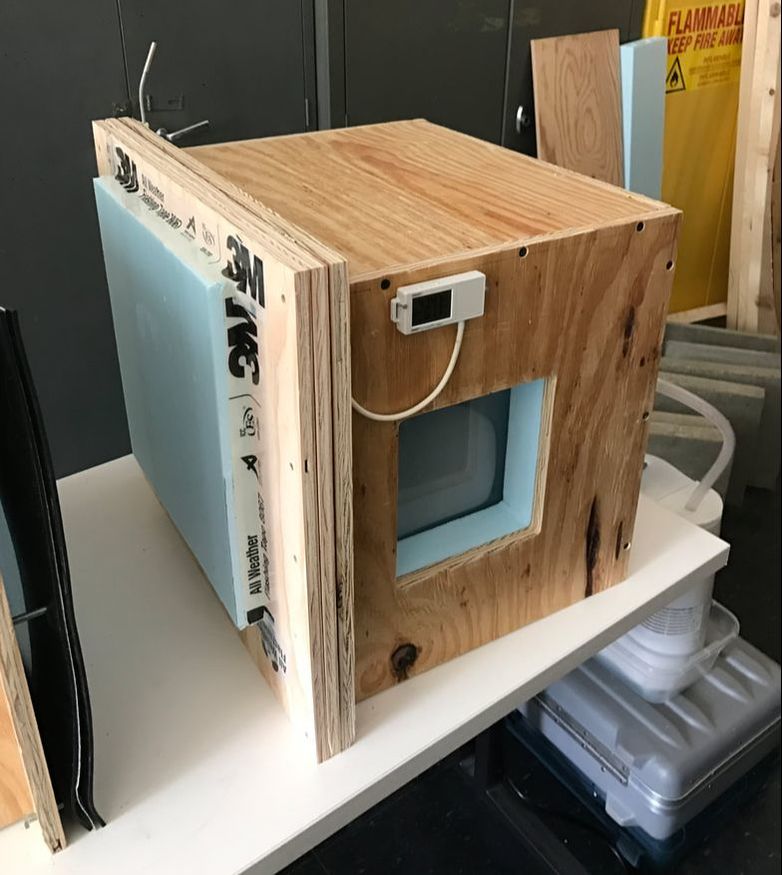
Preconditioning (box)
|
|
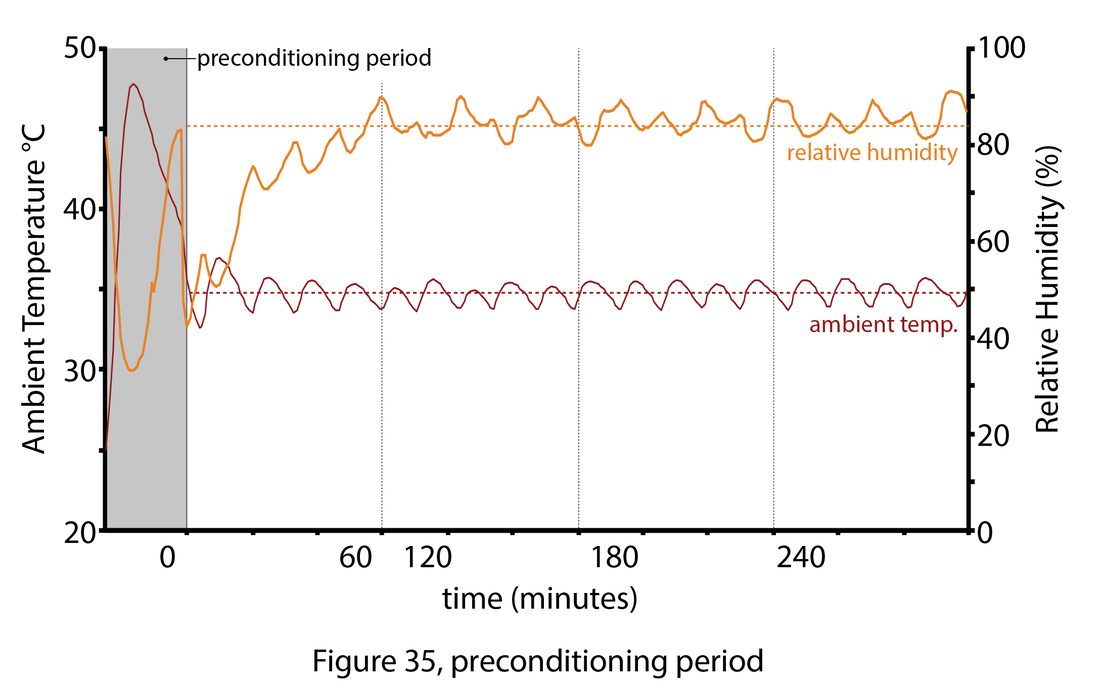
Before you jump right into testing your hypothesis, you need to make sure your apparatus is running properly. You may find that you need to precondition your setup. In the case of the 'environment box', I found that I needed to precondition the box for 30-40 minutes before an experiment to allow the heater and humidifier to get going. In the graph above, you can see that the temperature especially spiked during this time. Material specimens were only attached to the box after the preconditioning period (to maintain control between experiments)
Preconditioning (materials)
|
|
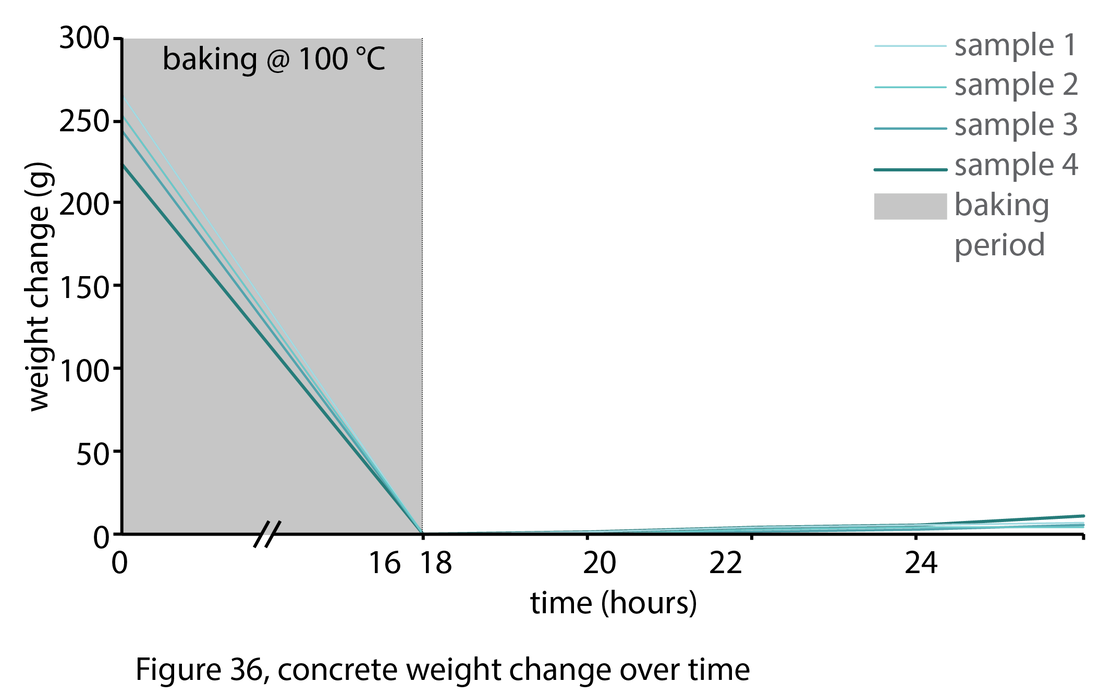
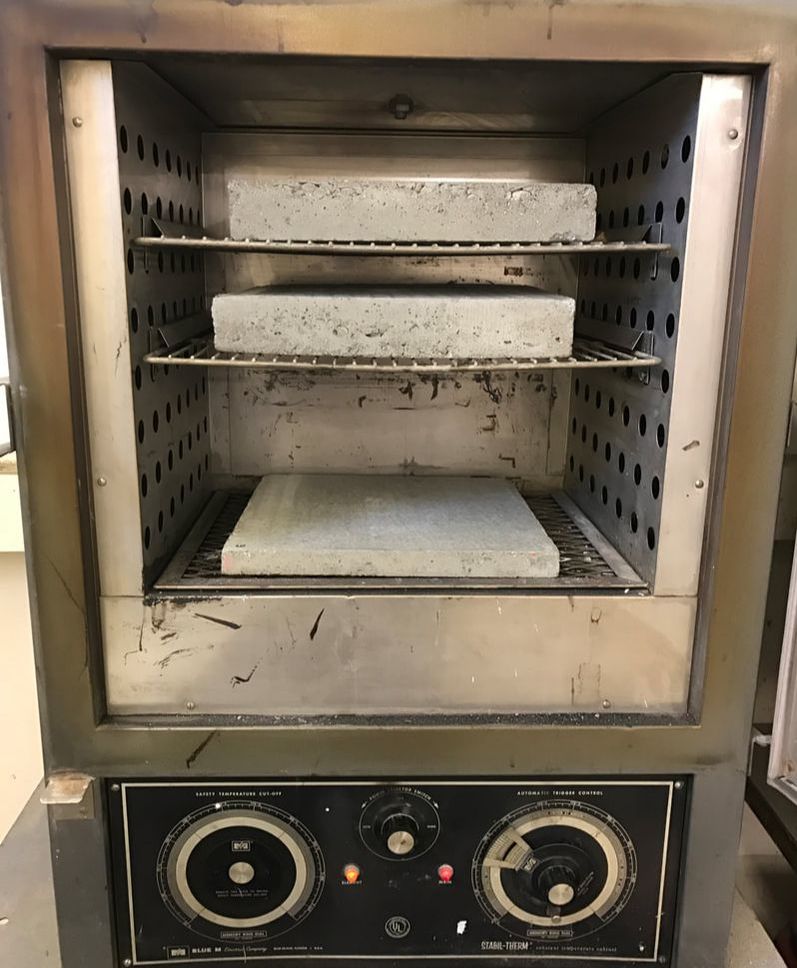
Materials are reactive to their environment - if you test a concrete panel that's been stored in cold, wet conditions, you're going to get different results than when you test a concrete panel that's been stored in a controlled setting. In the example above, I made sure to full desiccate my concrete panels by baking them in an oven. These procedures are outlined below but are crucial to get controlled results.
Parameters for gathering data
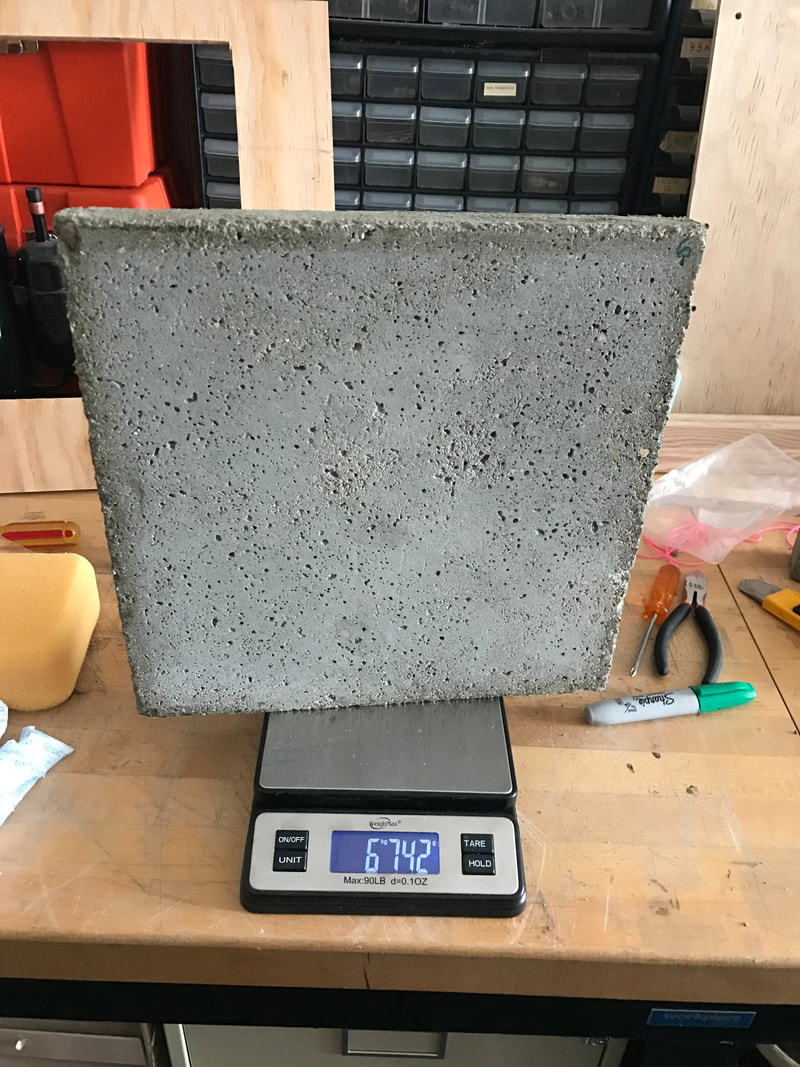
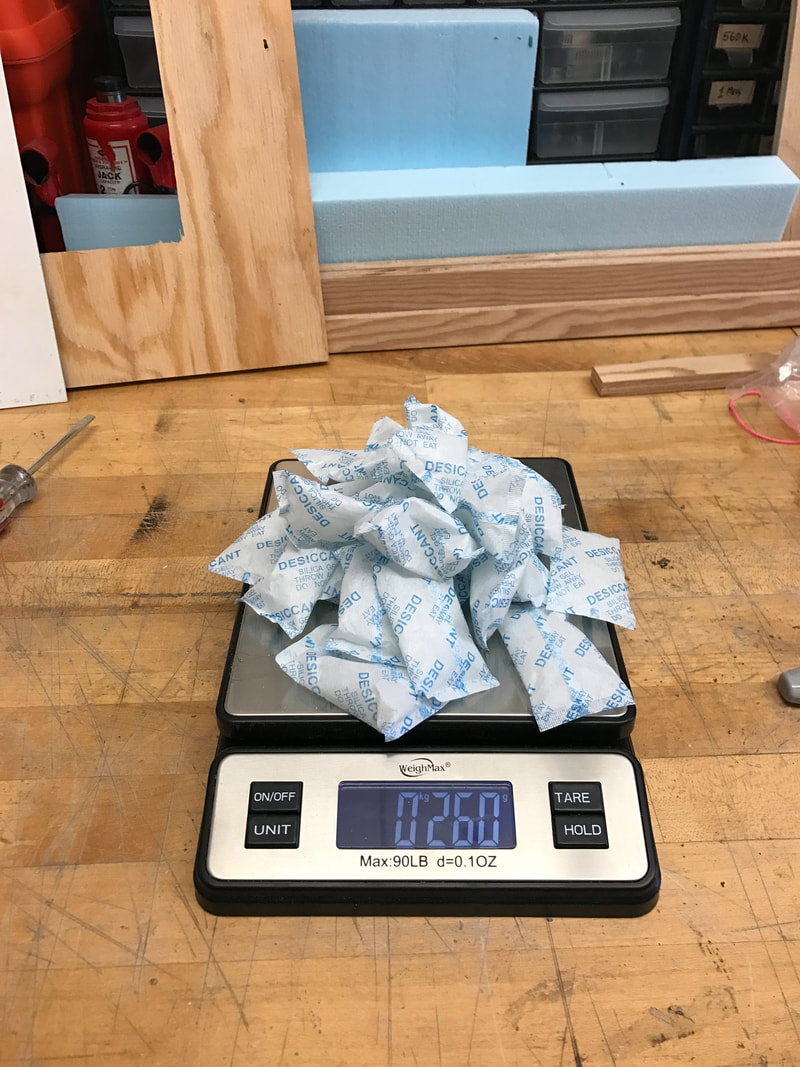
It may not be as simple as just measuring temperature and humidity. In the below example, I wanted to know how much moisture was actually being absorbed into the various materials, so I measured the weight of the sample before and after the experiment.
|
|
Essentially, your methodology should be so clearly spelled out that someone should be able to replicate your experiment without asking you any questions. And most importantly, they should be able to get the same results.
Example:
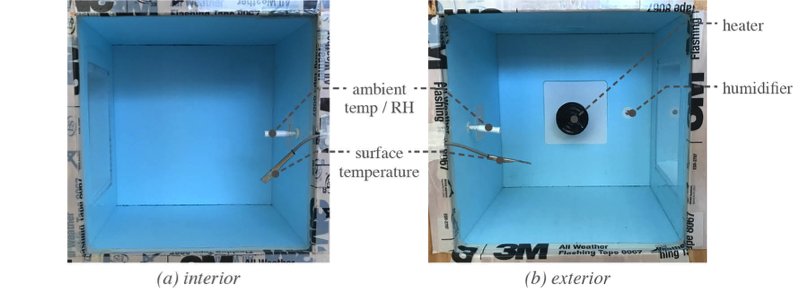
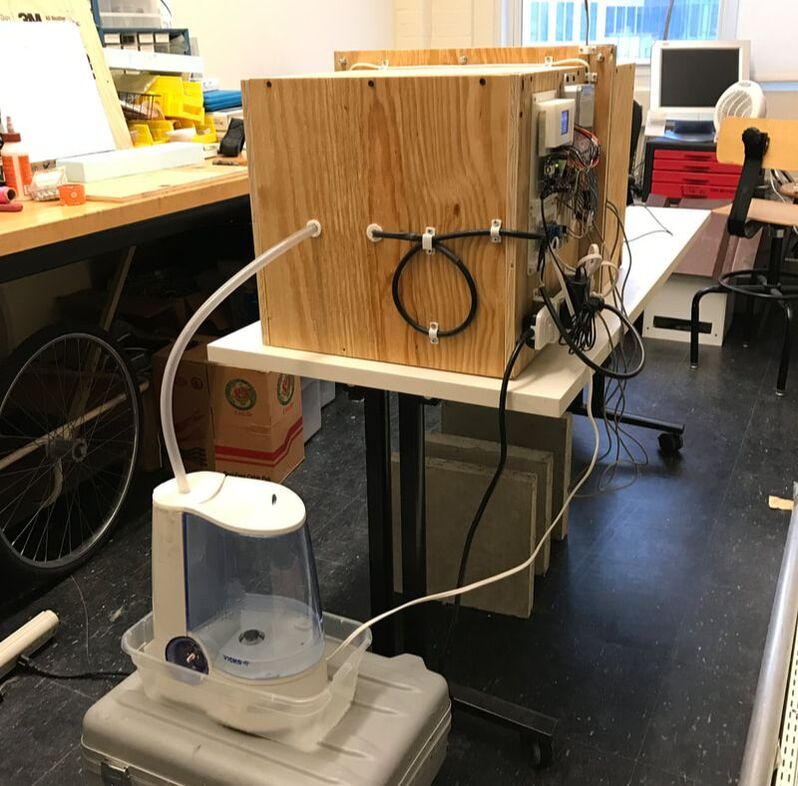
An interchangeable material specimen is sandwiched between a conditioned (hot-humid) and unconditioned chamber. Each box encloses 1 ft3 (.028m3) of clear volume with Onset HOBO sensors measuring ambient temperature, relative humidity, and surface temperature. Unlike commercial hotboxes, only one chamber is controlled to achieve steady-state conditions. This chamber, the ‘exterior’ chamber, simulates the hot-humid conditions commonly found in tropical climates. The unconditioned chamber represents the interior of an unconditioned building without accommodations for natural ventilation. When properly pre-conditioned, the exterior chamber operates within 1°C and 3% RH of set conditions.
|
Design Conditions: 35°C, 85% RH ASTM C1058 defines a moderate climate as one with anticipated exterior conditions ranging from 0-50°C. It recommends conducting the experiments at mean temperatures of 4, 24, and 43°C (ASTM International 2015). To make the temperature range more specific to tropical conditions, EPW weather data was consulted for Singapore, an urban tropical region that is only 1.35° north of the equator. There, annual temperature ranges from 21-33.8°C with a mean annual temperature of 27.5°C. Because the testing apparatus does not account for heat gain from solar radiation, the design temperature of the exterior box was set to 35°C. The ASTM standard does not specify test relative humidity conditions, so weather data was again consulted. In Singapore, relative humidity ranges from 43-100% with a mean annual relative humidity of 83.6% (ASHRAE 2016), so 85% RH was used for clarity. |
|
So that multiple experiments could be completed in a day, 4 hours was selected as the experiment run time. Each test involved a preconditioning period of the hotbox to account for the varying New England climate, where experiments were conducted, so only to subject the test materials to tropical conditions. Though the box is capable of testing for much longer periods of time, this shorter time allows the user to see quick results which can be used to develop the next design, as part of an iterative process.
Analyzing Moisture (and common mistakes)
Many of you are considering humidity as one of your variables. While we commonly speak of humidity in terms of a percentage (relative humidity) - it's important to note that RH is the percentage of water that the air can hold at that particular temperature. You will always see an inverse relationship between temperature and RH - the higher the air temperature, the more moisture it can hold. So even if the air doesn't change moisture level at all, the relative humidity will still drop, which can be misleading.
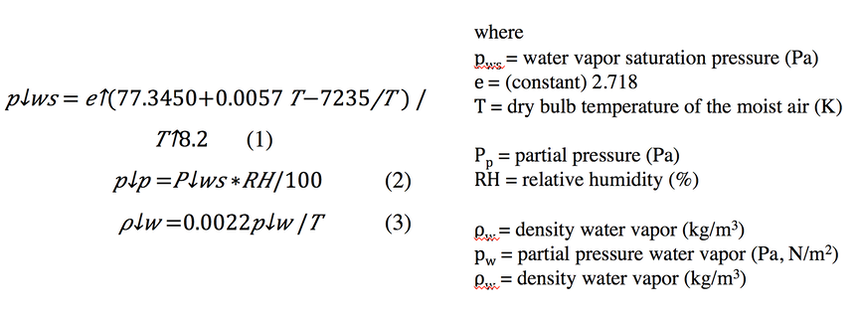
The dew point is a helpful metric because it quantifies the temperature at which air will become full saturated. The higher the dew point, the more humid the air. Another option is to quantify the mass of water vapor. Remember the psychometric chart? This is the vertical axis, so if you know the temperature and RH (or dew point), you should be able to calculate the mass of water vapor (graphically). You can also use math:
The dew point is a helpful metric because it quantifies the temperature at which air will become full saturated. The higher the dew point, the more humid the air. Another option is to quantify the mass of water vapor. Remember the psychometric chart? This is the vertical axis, so if you know the temperature and RH (or dew point), you should be able to calculate the mass of water vapor (graphically). You can also use math: