Methodology
The scope of work for the project had three main areas of interest, the first being an algae study that looks at the amount of visible and lux levels that are able to penetrate it. The second an operable panel system that can be used for a greenhouse project, and the last one being a sealable water solution for the panel to work.
Due to the shear scope of work and the time constraints of this project, the scope was reduced down to focus on the light study of the algae. The method used was reducing the percent algae to water ratio in increments of 25% and recording that data. The goal of this test was to see how much of a difference fully grown algae has a the density of light that is allowed to pass through the system.
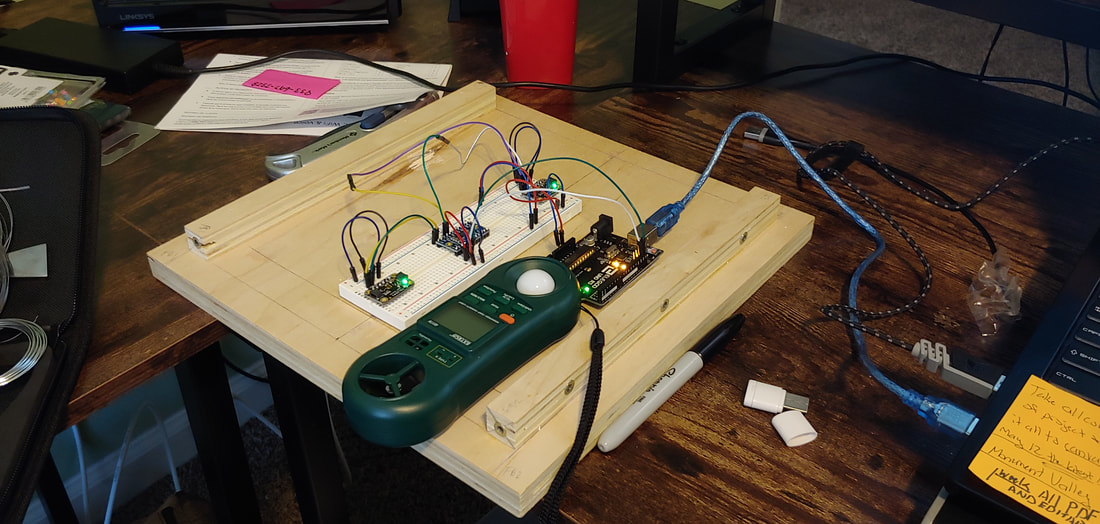
The controls for the project first saw sensor setup outside of the box, to test the difference in levels between the first and second sensor and a meter outside the box that would record the intensity of the light without the obstructions of a window or enclosed space as a comparative method.
Due to the shear scope of work and the time constraints of this project, the scope was reduced down to focus on the light study of the algae. The method used was reducing the percent algae to water ratio in increments of 25% and recording that data. The goal of this test was to see how much of a difference fully grown algae has a the density of light that is allowed to pass through the system.
The controls for the project first saw sensor setup outside of the box, to test the difference in levels between the first and second sensor and a meter outside the box that would record the intensity of the light without the obstructions of a window or enclosed space as a comparative method.
Initial Testing and Comparison of Sensors and Meter
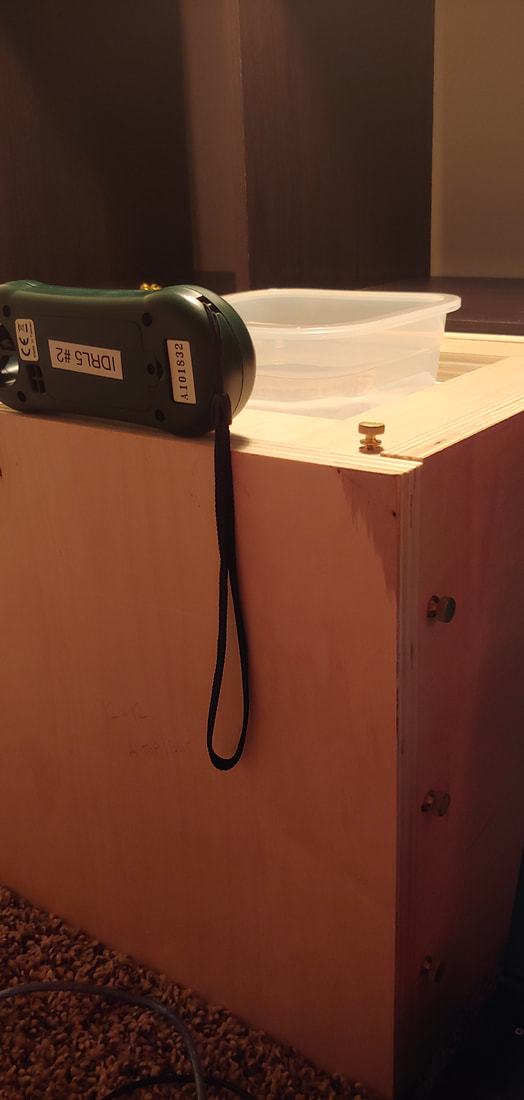
The second control, set the box, light, and all sensors in the environment that it would be in for the duration of the testing. This box did not move change or be touched during the duration of the testing. This prevents any difference in the light recording to be reduced to primarily to the algae, from tests of the method and knowing electricity is fluctuating that reading can vary slightly.
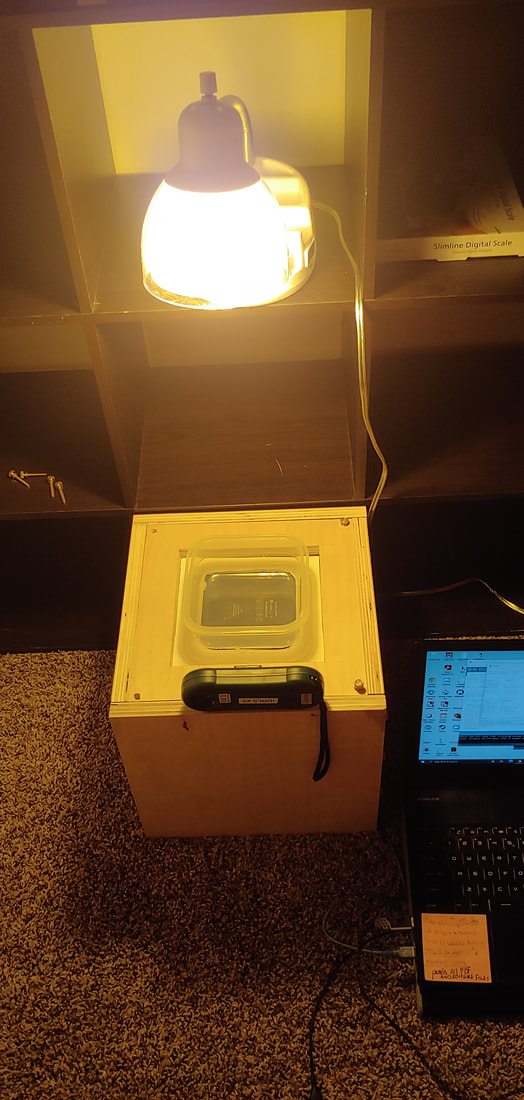
Control Setup
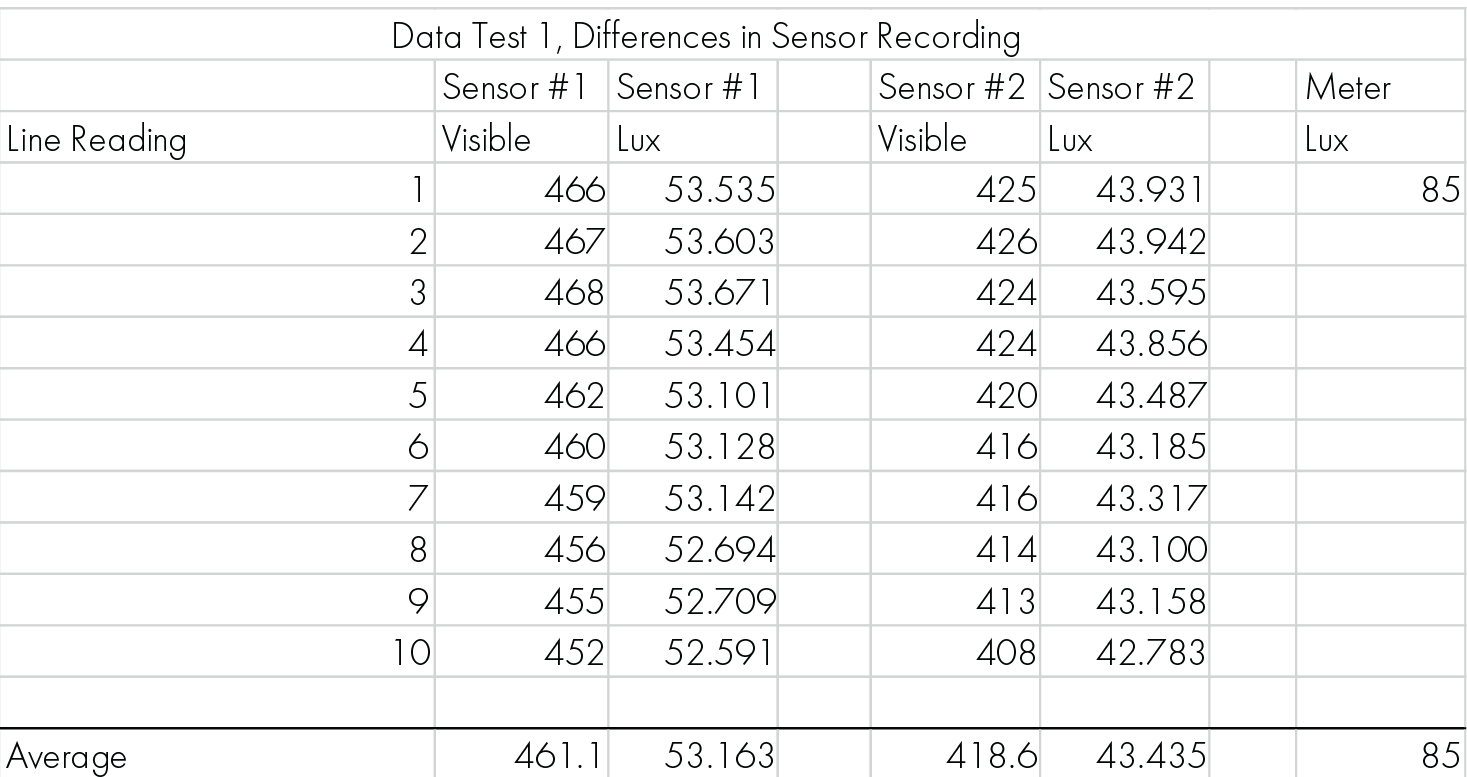
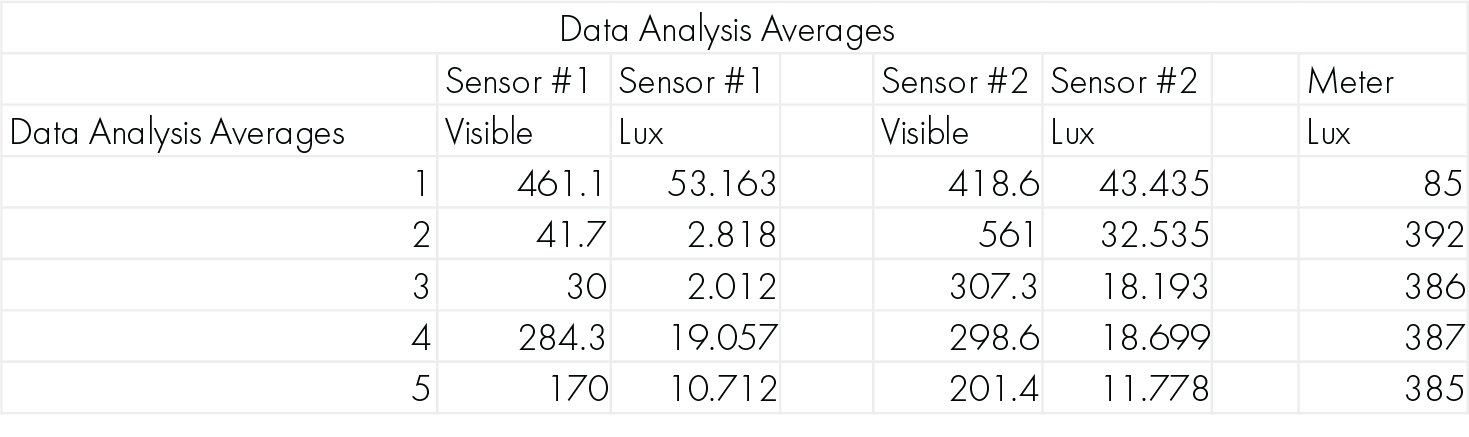
The recorded data is compiled and the first 10 lines of recording is used to represent the reading for the test. This information is then taken and averaged to get a result to be used in comparison between the 2 sensors. The following images are the algae set-ups for all of the results on the later pages and a sample of data.
|
|
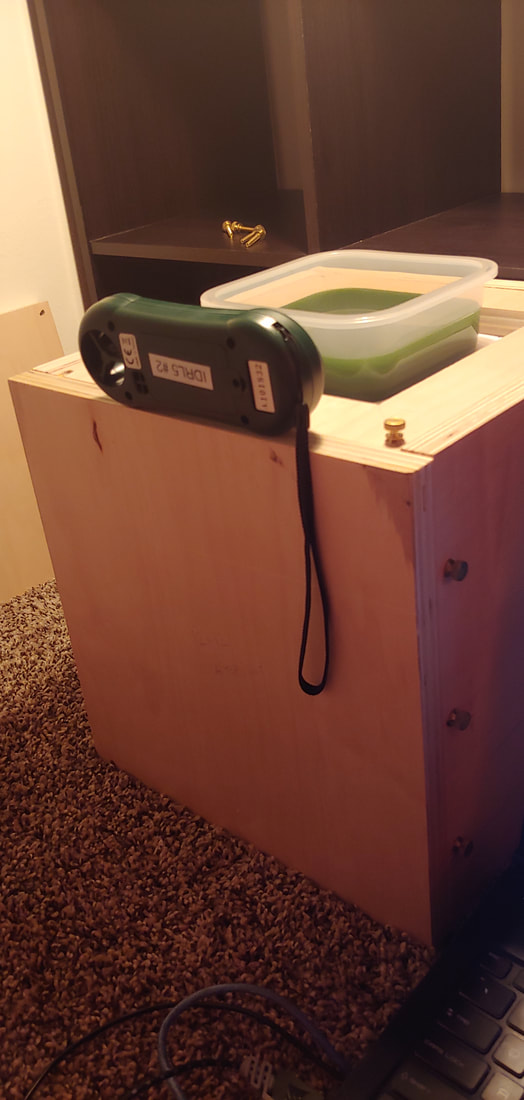
Algae 100%
|
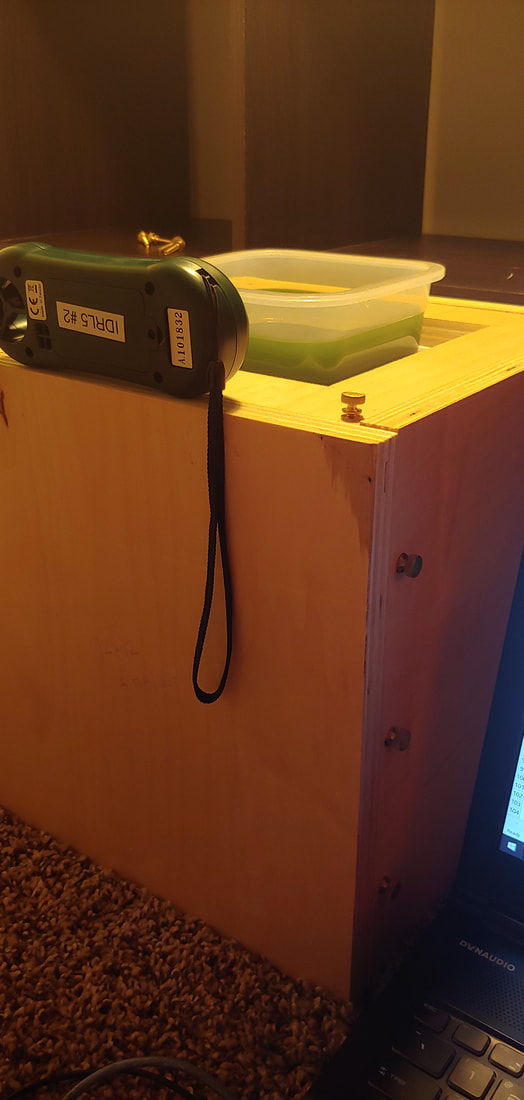
Algae 75%
|
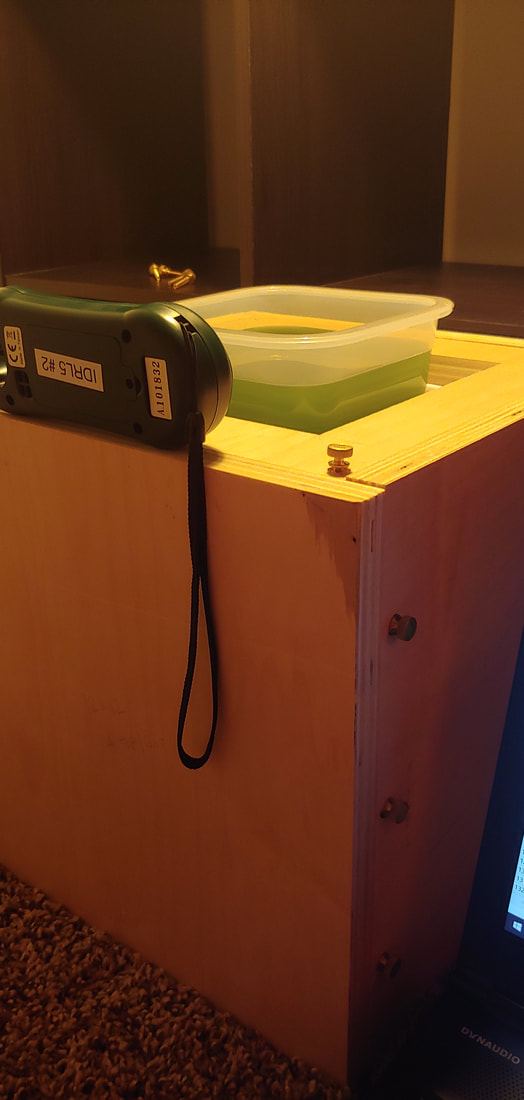
Algae 50%
|
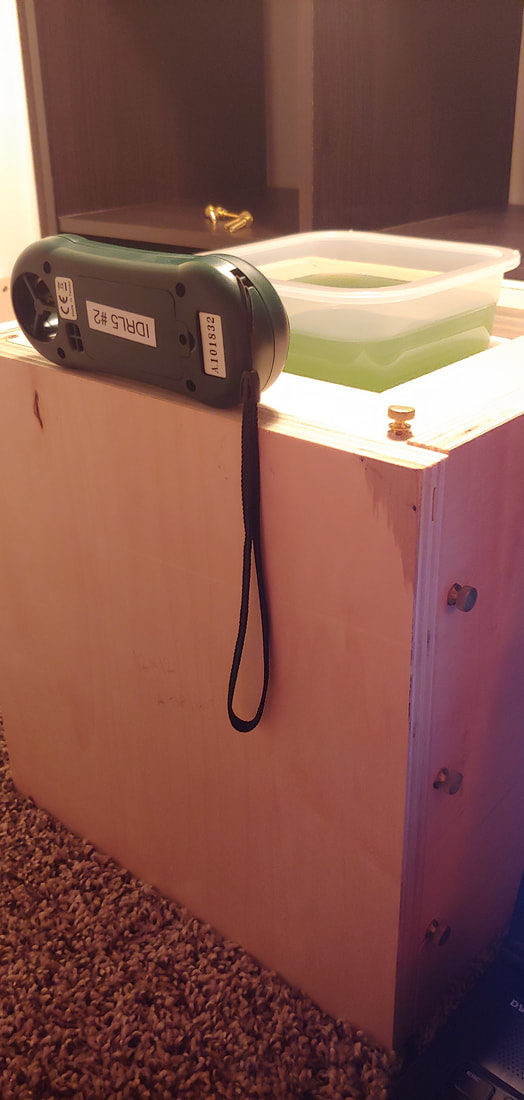
Algae 25%
|
Algae 0%
|