Methodology
Hypothesis:
- Control Cube: This test should give a base line reading on how regular concrete withstand a compression load.
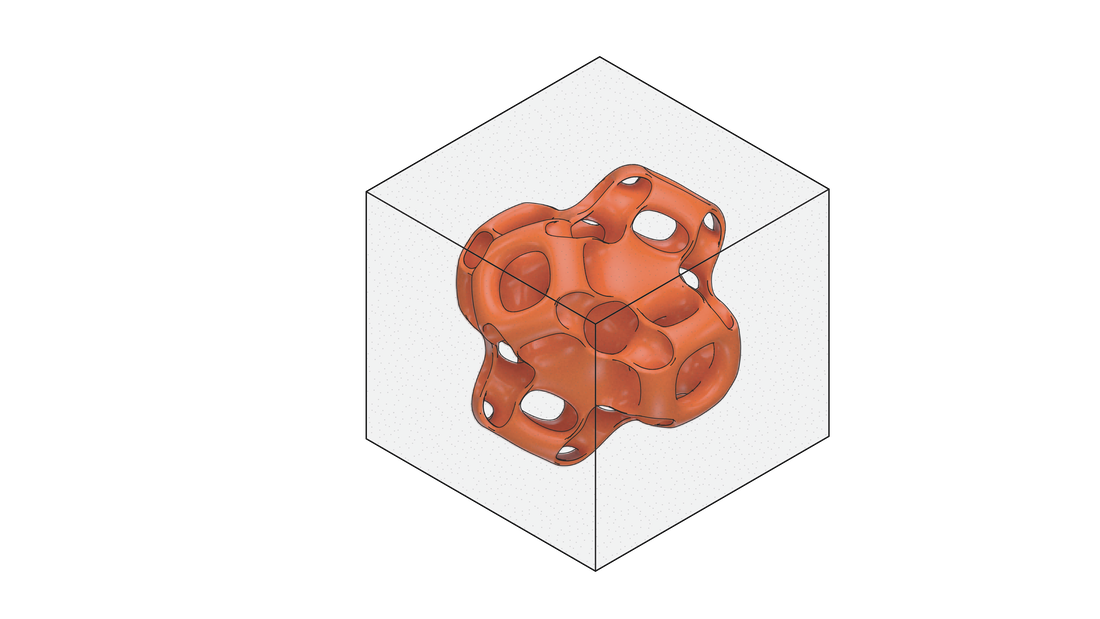
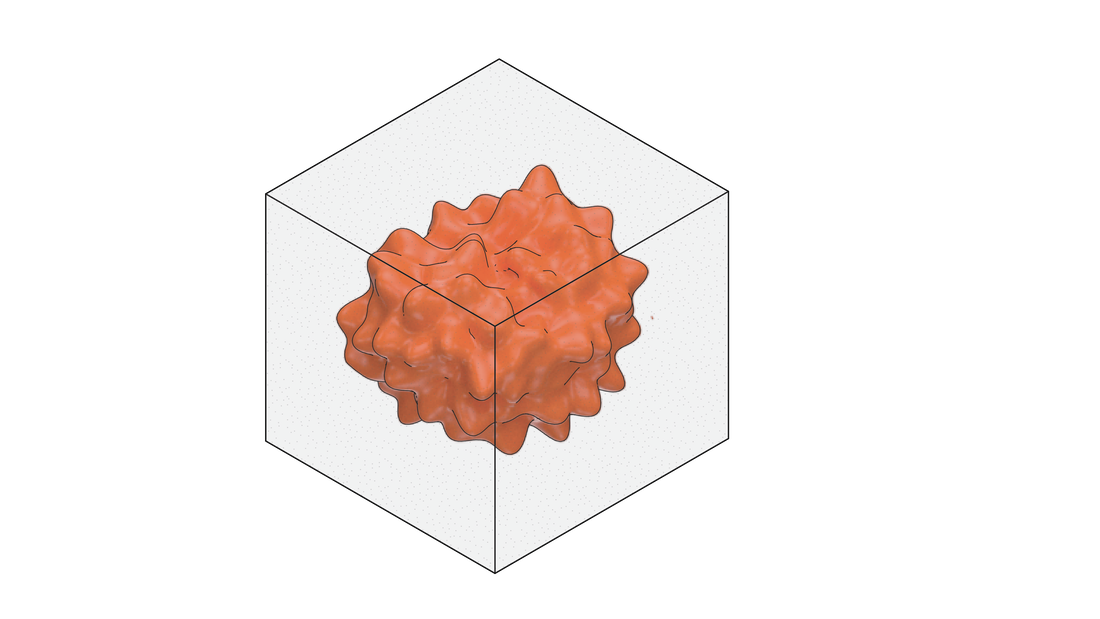
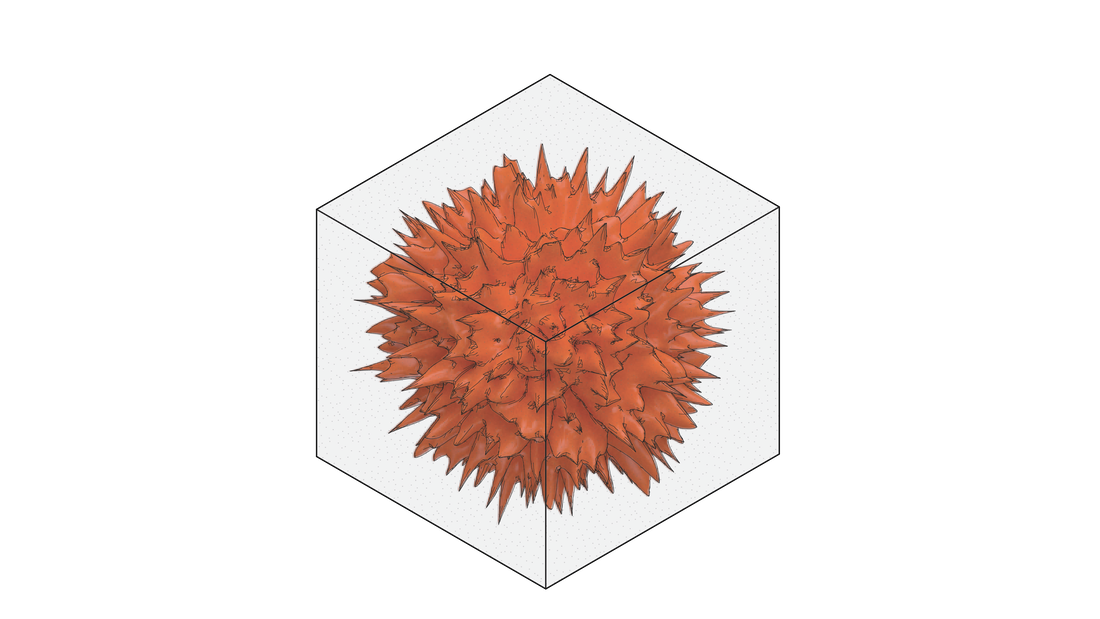
- Gyroid Cube: This test should show the strength of the concrete block with the new geometric cube inside. If studies are correct the cube should be stronger than the base control cube.
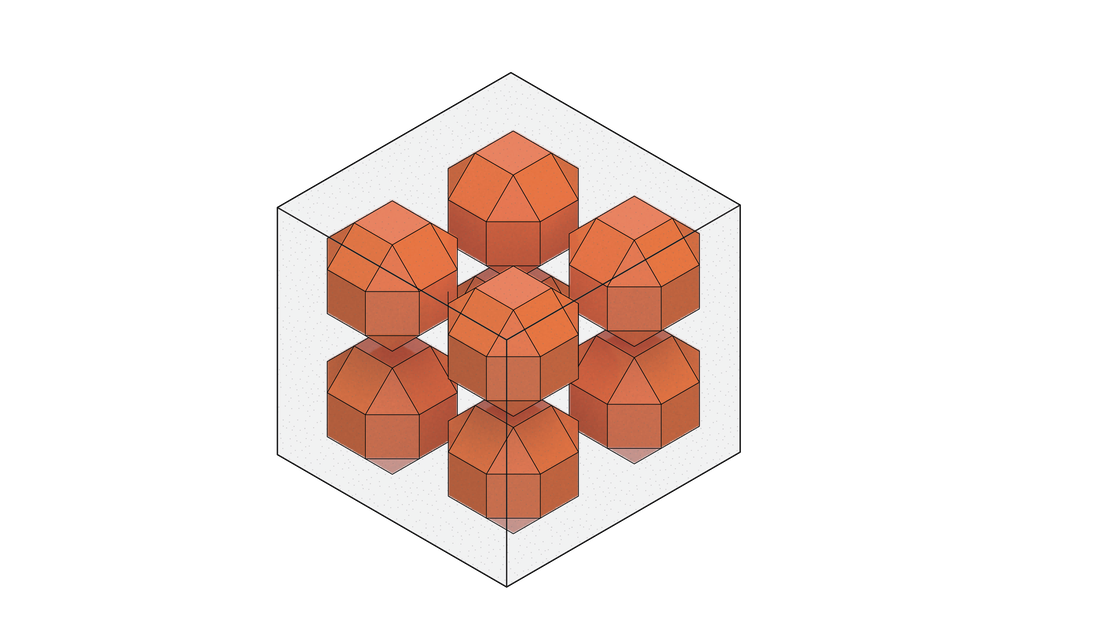
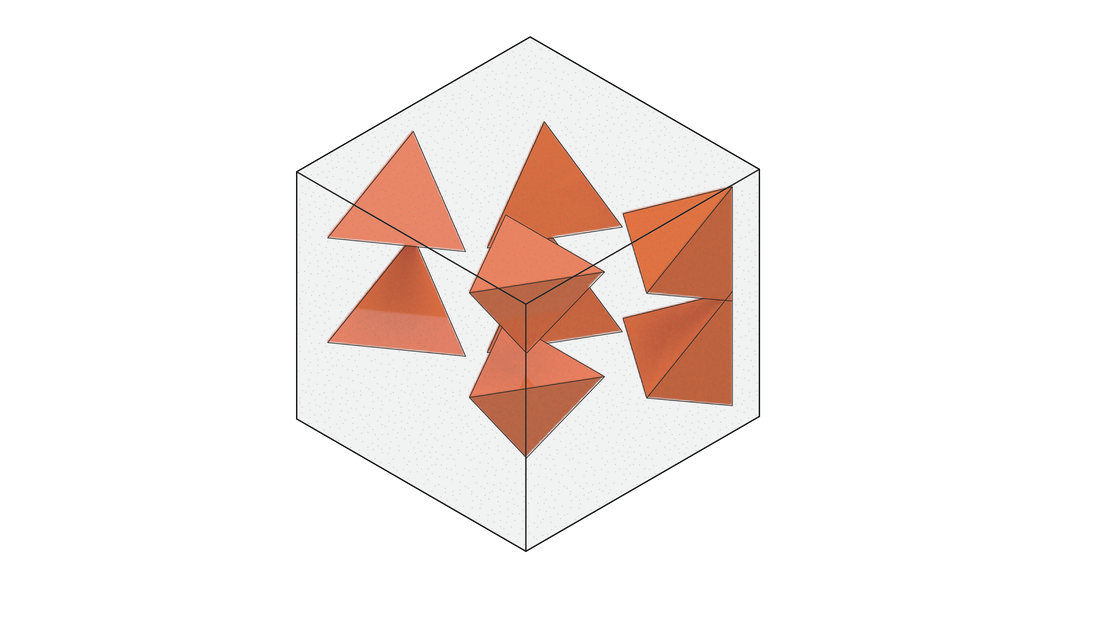
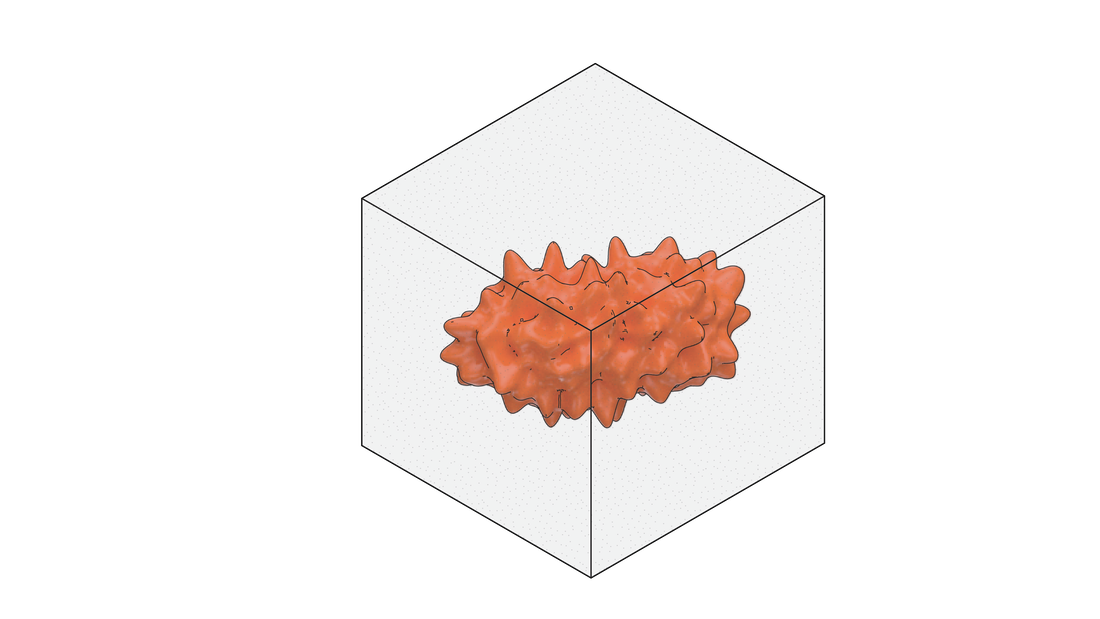
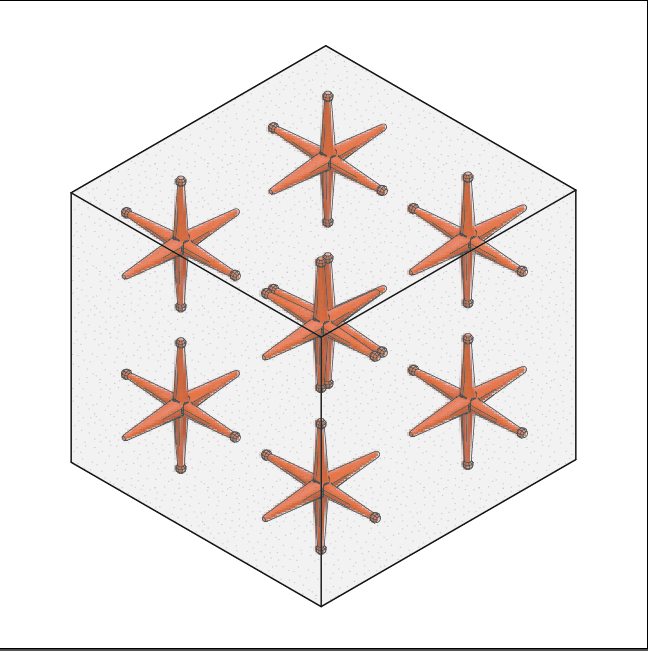
- Jack Cube: This test should show the displacement of several smaller shapes geometries. See how the force can spread throughout the solid cube.
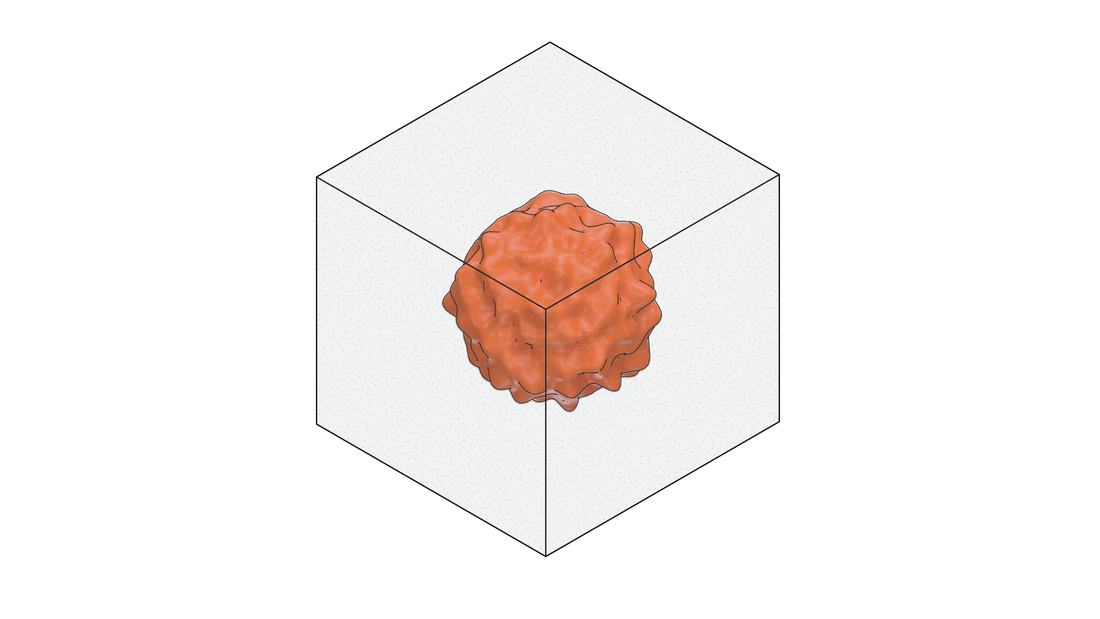
- Gyroid Jack Cube: This final cube should show the result of combining the stronger gyroid cube with the displacement of the jacks. Which should strength close to the gyroid cube using less material?
See below for instructions.
- Materials Needed:
- 1lb box of rockite
- 8 oz of water
- Scale
- Mixing stick
- Mixing container
Instructions:
1. Place container for mixing rockite on the scale
2. Zero out the scale and start pouring rockite into the container until 13.5 ounces is achieved.
3. Zero out the scale again and pour in water until 3.8 ounces is achieved.
4. Take container for mixing off the scale and start mixing by stirring in a clockwise fashion until all of the lumps have disappeared and the rockite is about pancake mix consistency.
5. Note: It cannot be too watery or the concrete will not cure properly and it cannot be too thick or it will create cracks.
6. Pour into form for 2.5"x2.5"x2.5" cube.
7. Allow to cure for 12-24 hours.
8. Note: Create all the tests in this fashion with each form containing different geometric shapes.
Compression tests:
The compression tests are meant to do two things. The first is to evaluate the compressive rating of concrete with the added geometries and to visually analyze the way in which the concrete breaks.
Scenarios can include:
-Concrete explodes uniformly
-concrete breaks where there is no geometry binding it (ie the jacks)
-concrete cracks, yet it is still held together by geometry
-plastic geometry fails before the concrete (sensors may help us make those predictions) -combined with the plastic concrete can deform slightly before shattering.
Form Work Assembly Diagram // Designed for Multiple Concrete Pours
Test System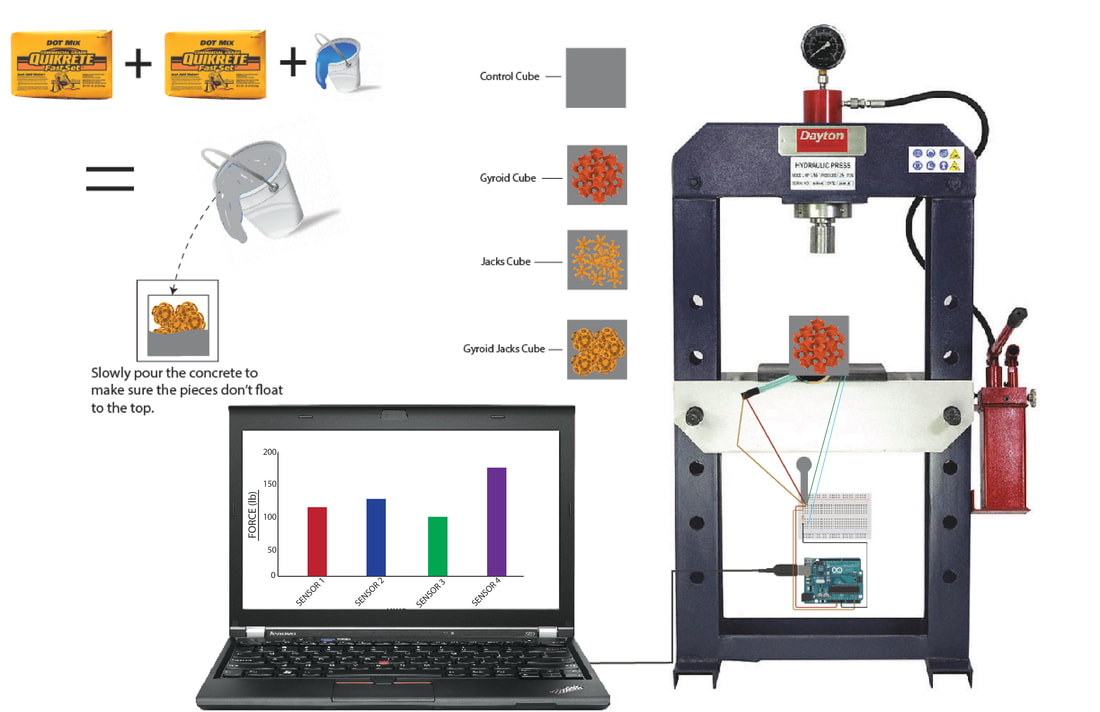
Curation Time Optimization :
Load Diagram :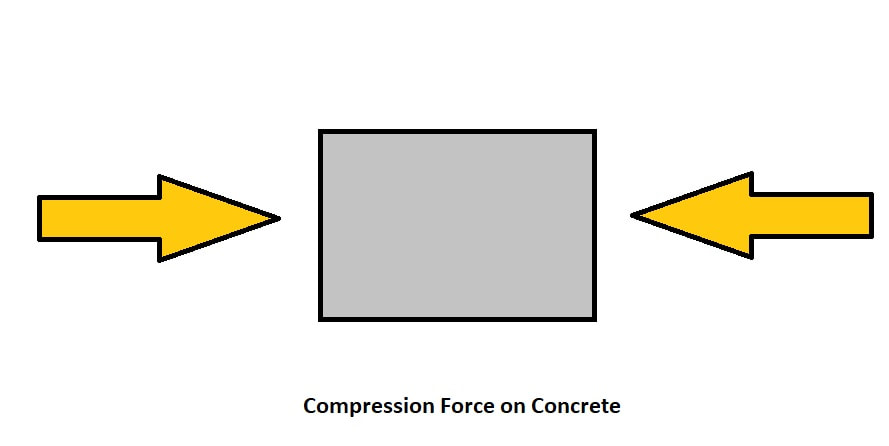
Gradual Stress Failure of Concrete Based on Percentage :"The strain at failure is typically around 0.005 for normal strength concrete, as shown in Figure 2. The post peak behaviour is actually a function of the stiffness of the testing machine in relation to the stiffness of the test specimen, and the rate of strain. With increasing strength of concrete, its brittleness also increases, and this is shown by a reduction in the strain at failure."
Prof. Jason Weiss, School of Civil Engineering, Purdue University. 
|
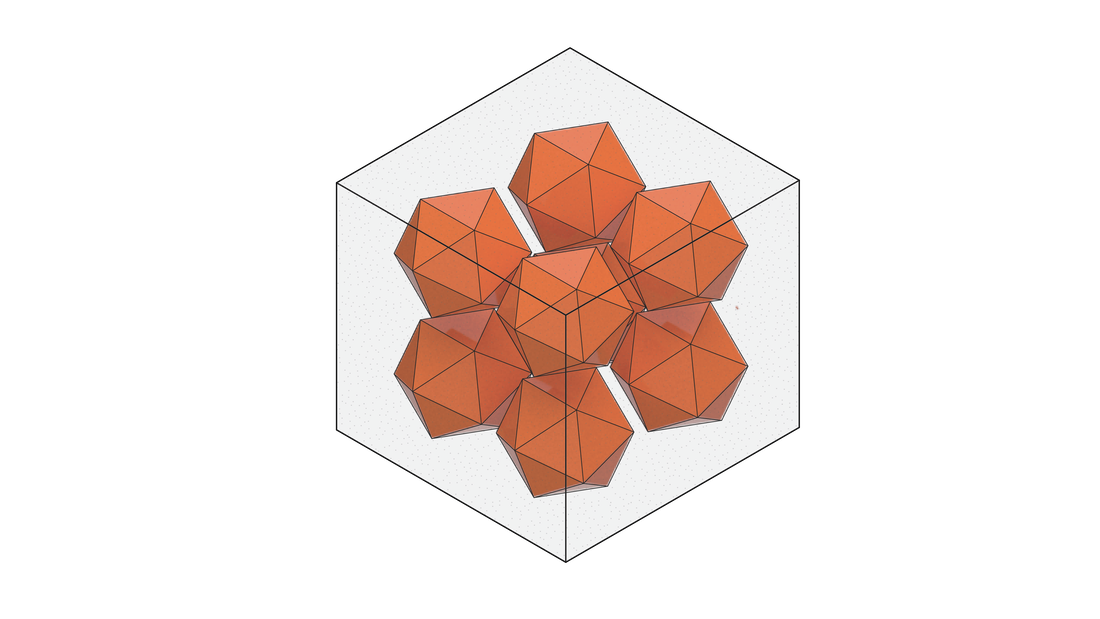
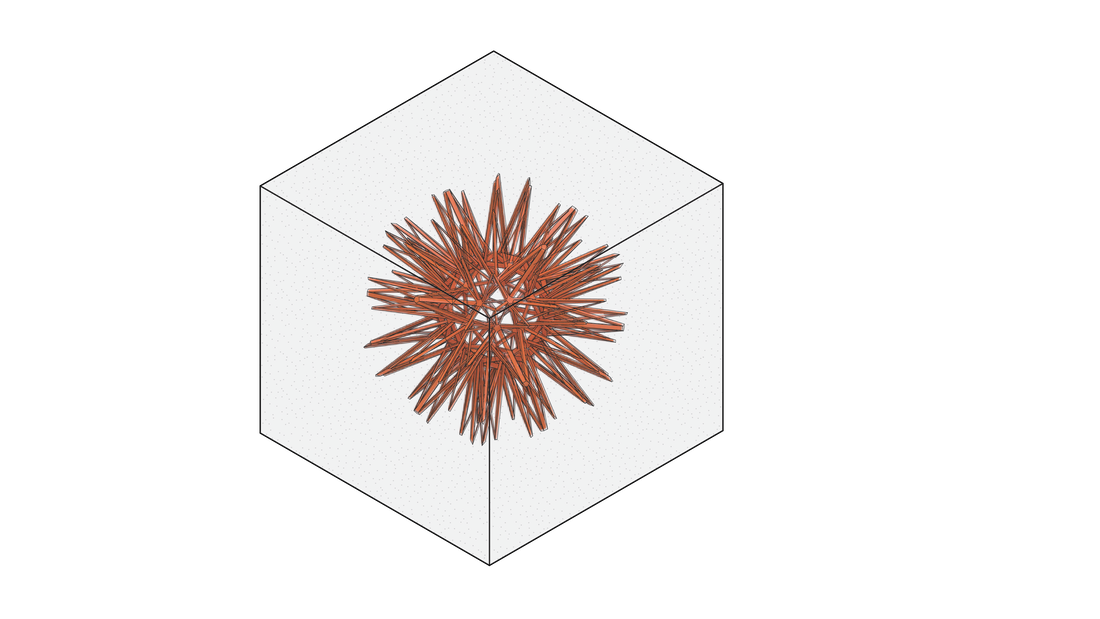
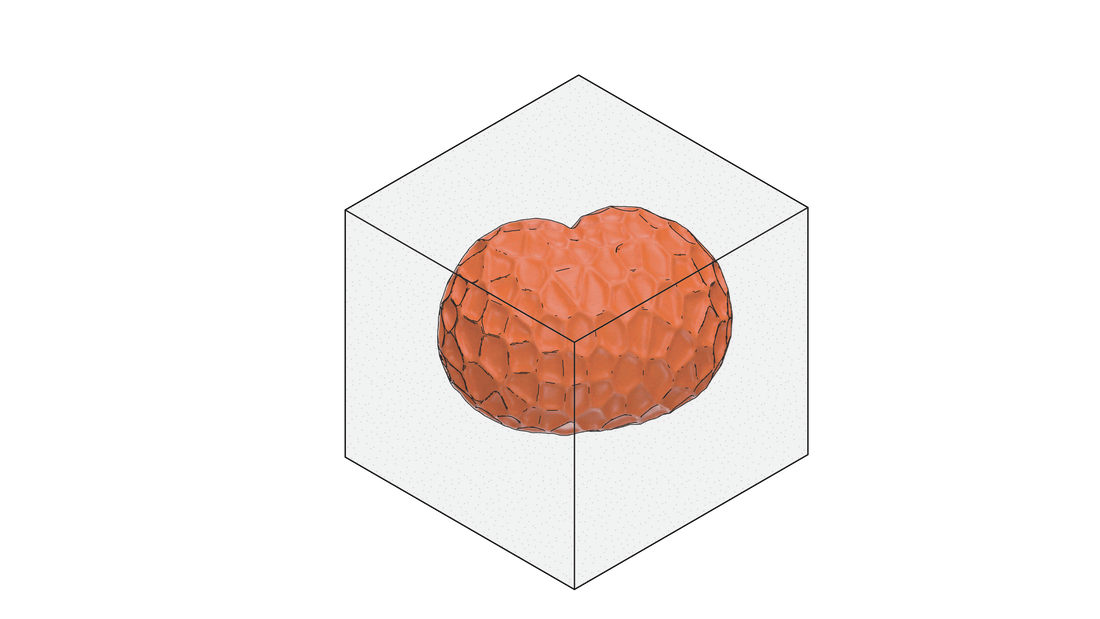
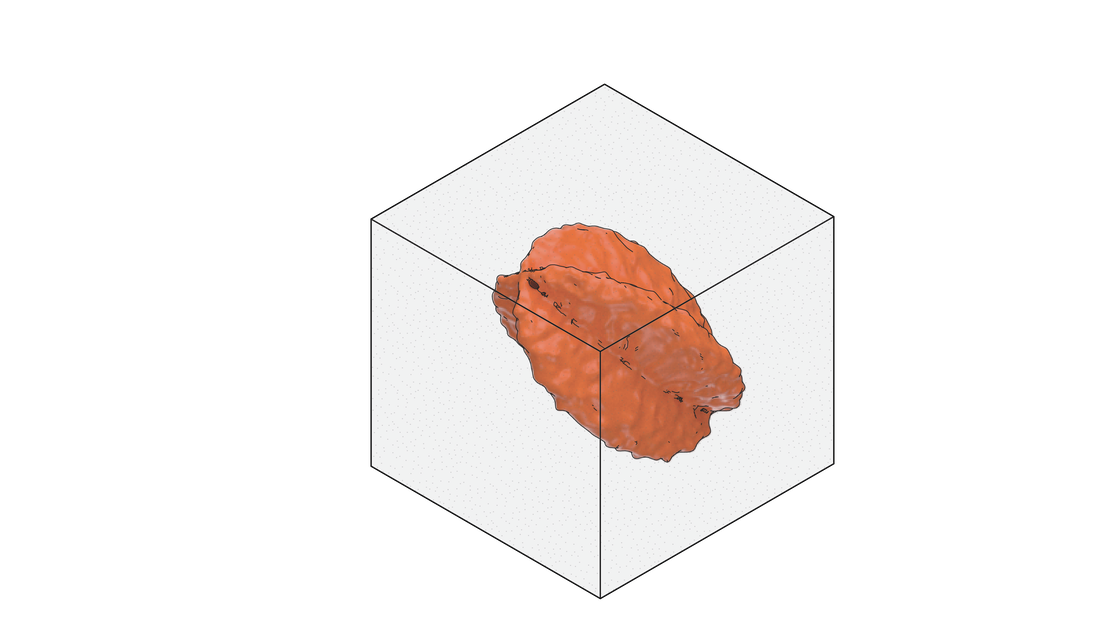
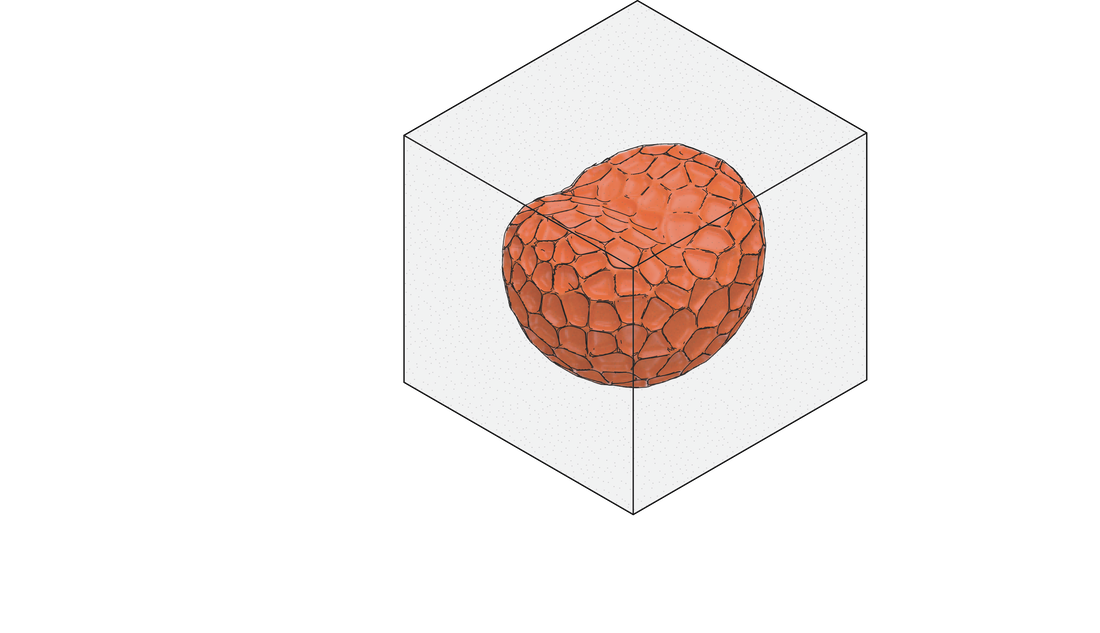
Illustrated Diagrams of Possible Internal Geometries // Geometric & Biological

| gyroid.3dm |
Hydraulic Press Illustration // Visual Understanding // Concrete Cube Testing