Methodology
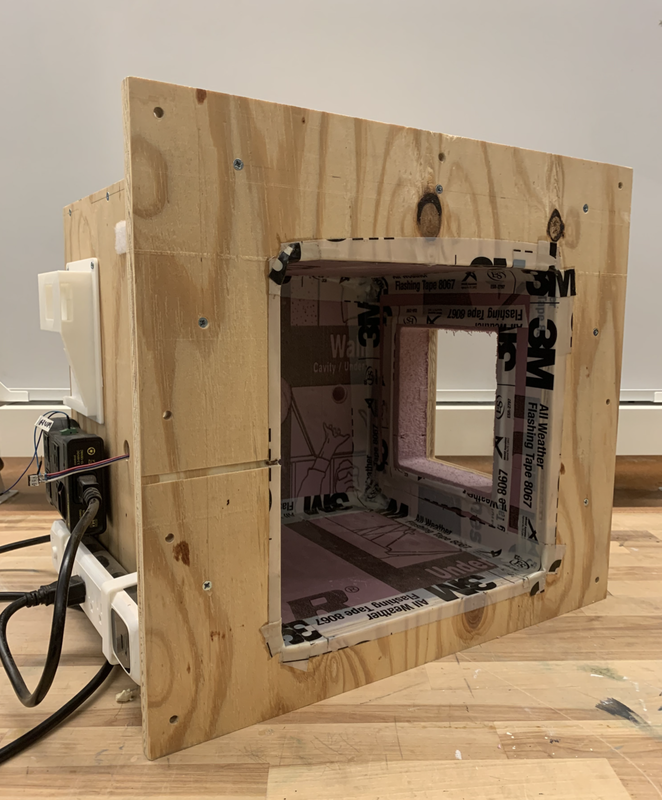
Fig. 1 Physical testing box. (provided)
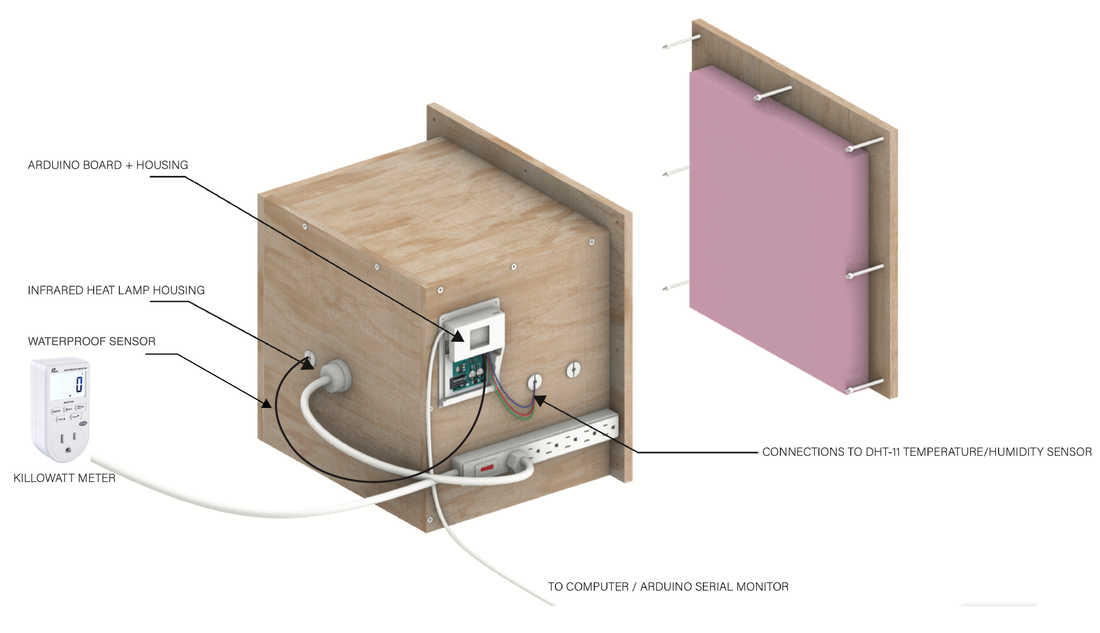
Fig. 2 Rendered axonometric of the provided box with added components.
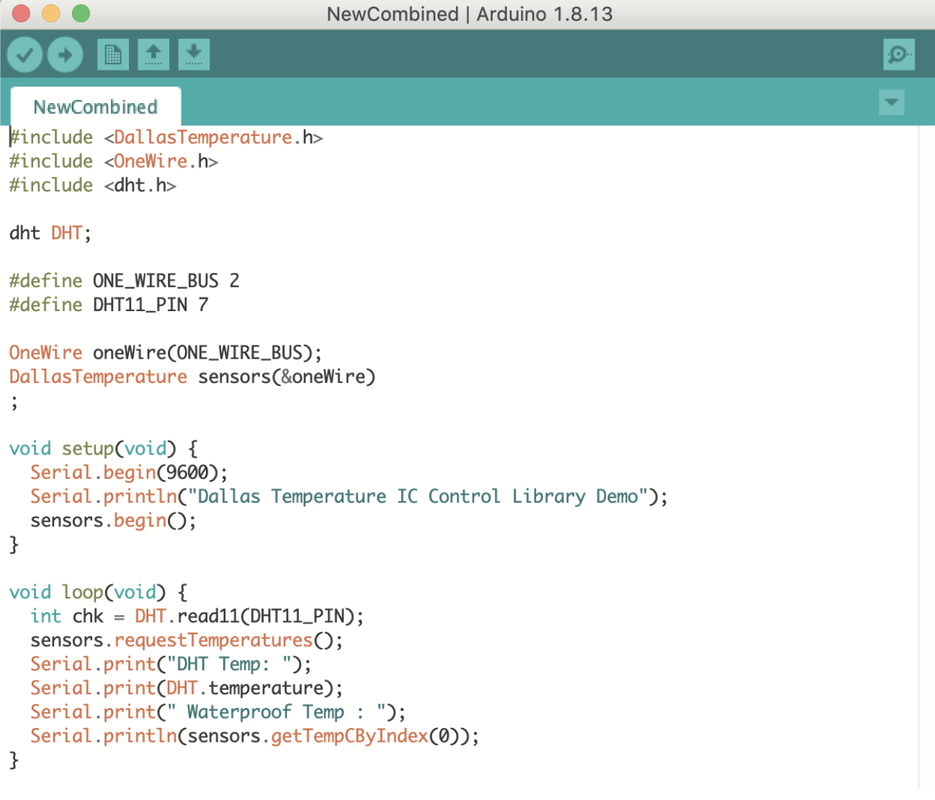
Fig. 3 Final code for DHT-11 and DS18B20 sensors
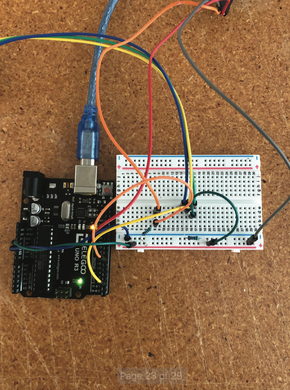
Fig. 4 Final wiring for Arduino. DHT-11 and DS18B20 sensors
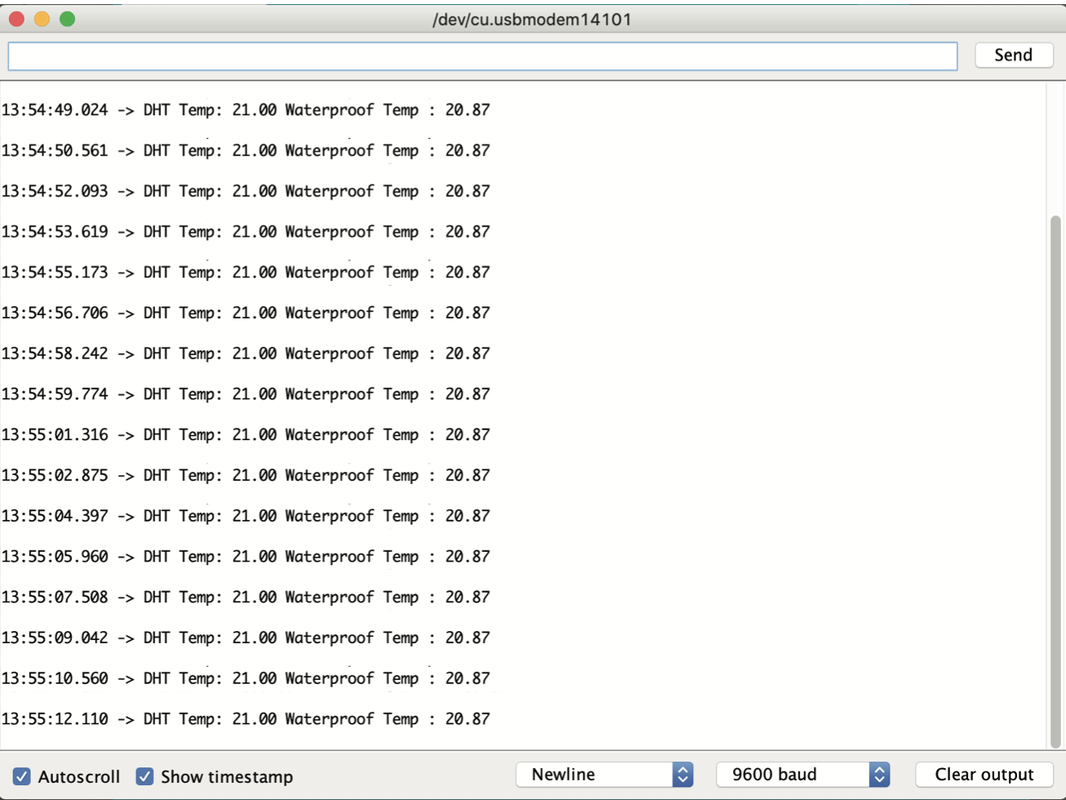
Fig. 5 Temperature readouts from the DHT-11 and DS18B20 sensors in degrees celsius
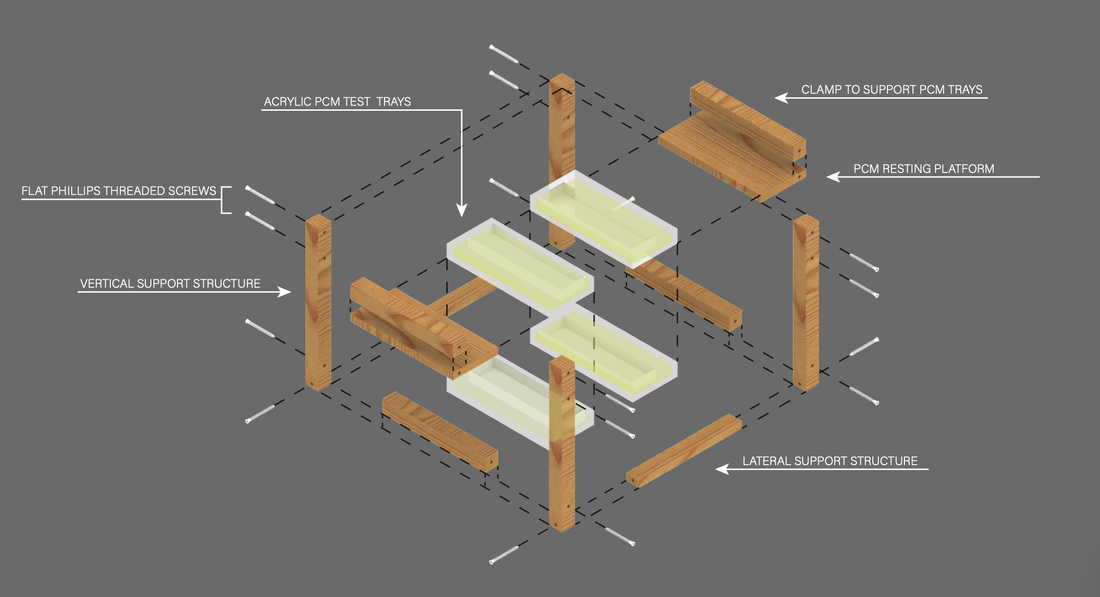
Fig. 6 Initial diagram of testing apparatus
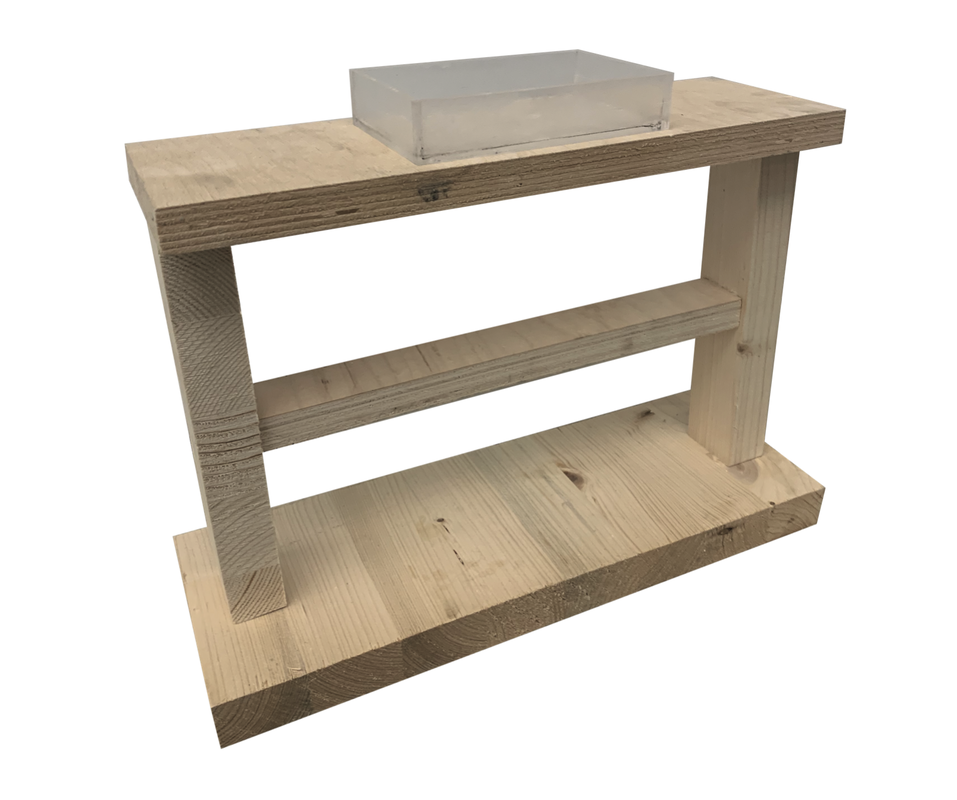
Fig. 7 Simplified testing apparatus
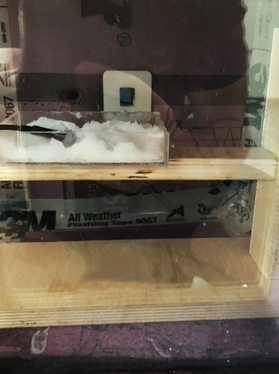
Fig. 8 PCM sample on testing apparatus with DHT-11 and DS18B20 recording data
|
This box was lent to us by our professor, Liz McCormick (Figure 1). We added the electronics and created our own wiring from online resources, as well as a troubleshooting session with our professor to combine the code for the DHT-11 sensor and waterproof probe. The environment box lent to us which we did not make, has a plywood exterior. Five out of the six sides are enclosed. One face is open so we can insert and remove phase change materials and fixtures from the box. There is a window on the right face, covered by plexiglass for easy viewing of the process. Rigid pink insulation fits together through ridges and lines the interior of the box. It then forms a barrier to trap heat once the foam is assembled with sealing tape. On the back face of the box, an infrared heat lamp is passed through a circular hole. A 3D printed holder keeps the lamp in place while ensuring air does not seep out through the hole, which would create a thermal bridge. The front of the box has a piece of plywood forming a rectangular border around the open face of the box (Figure 2). Another identical piece of plywood is clamped in front, with a rectangular block of rigid pink insulation in between to seal the box. Screws and bolts are used to fasten all pieces of plywood together, as well as to seal the box before tests are run. On the left side of the box, there are 3D printed pieces for housing the Arduino board, breadboard and surge protector which powers the kilowatt meter, infrared heat lamp, and computer (Figure 5).
Moving more in depth to the electronics, we used an Arduino Board to upload code to our sensors. We connected a DHT-11 temperature and humidity sensor as well as a waterproof probe sensor to the Arduino Board by running male to male 65 jumper wires from a breadboard. We used a USB cable to connect the board to a computer. It did not require an additional power source such as a power bank, which is sometimes the case. The DHT-11 sensor was housed inside the box. A 3D printed fixture kept it in place and reduced thermal bridging. The waterproof sensor was passed through a small hole in the box, then secure by another 3D printer wire holder. As for the wiring, the DHT-11 sensor was connected to 5V, ground, and pin 7. The DS18B20 waterproof temperature sensor was connected to 5V, ground, and pin 2. Then the connected probe was carefully passed through the box and inserted into the phase change material. The code itself was completed after multiple troubleshooting sessions. We ended up combining codes from several websites in order to run the code for the DHT-11 and DS18B20 simultaneously on the same computer (Figure 3). We ran into several errors which we identified as a lack of libraries installed. We installed Dallas Temperature, One Wire, and DHT libraries. We then specified the DS18B20 connection to pin two as well as the DHT-11 connection to pin seven (Figure 4). We then told it to print the libraries and start up the sensors. They are instructed to print values continuously approximately every second (Figure 5). They read temperatures in Celsius and we used a formula in tableau to convert each reading to Fahrenheit. We outlined a method for running the experiment before we began testing. It varies slightly from our actual process. I will describe our preliminary methodology and then the changes that we made when beginning testing. The first step is to plug in the infrared heat lamp into the kilowatt meter. This way we can record the amount of energy the lamp is drawing from power at all times. Then, allow the interior temperature of the box to rise to 95 degrees Fahrenheit. During this time, the sensors are recording the temperature inside the box and of the phase change material: coconut oil. Once this maximum temperature is reached, the infrared heat lamp is turned off. The sensors will continue to record the temperature as the box and phase change materials cool down. We observed that both temperatures will continue to climb even after the bulb is turned off, as residual heat is trapped inside the box. After the phase change material has been cooling for a few hours, we remove it from the box and let the box air out before running another test. This is fairly similar to our final process, with a few exceptions. We ran two tests using the jig that allows us to place testing trays in various locations within the box (Figure 6/7/8). The tests did not demonstrate a huge difference in heat retention or regeneration, so we determined the jig was not helping. We ran another test and increased the amount of coconut oil used to seven ounces. We turned the heat lamp off before the coconut oil reached 95 degrees Fahrenheit, as we observed from previous experiments the box would overheat from residual heat even after the bulb is off. We originally planned on using a heat gun but were able to acquire the waterproof sensor which was much more efficient and would not require us to open the box, which would let all the heat out. Other than these modifications, our methodology remained the same |