Methodology
|
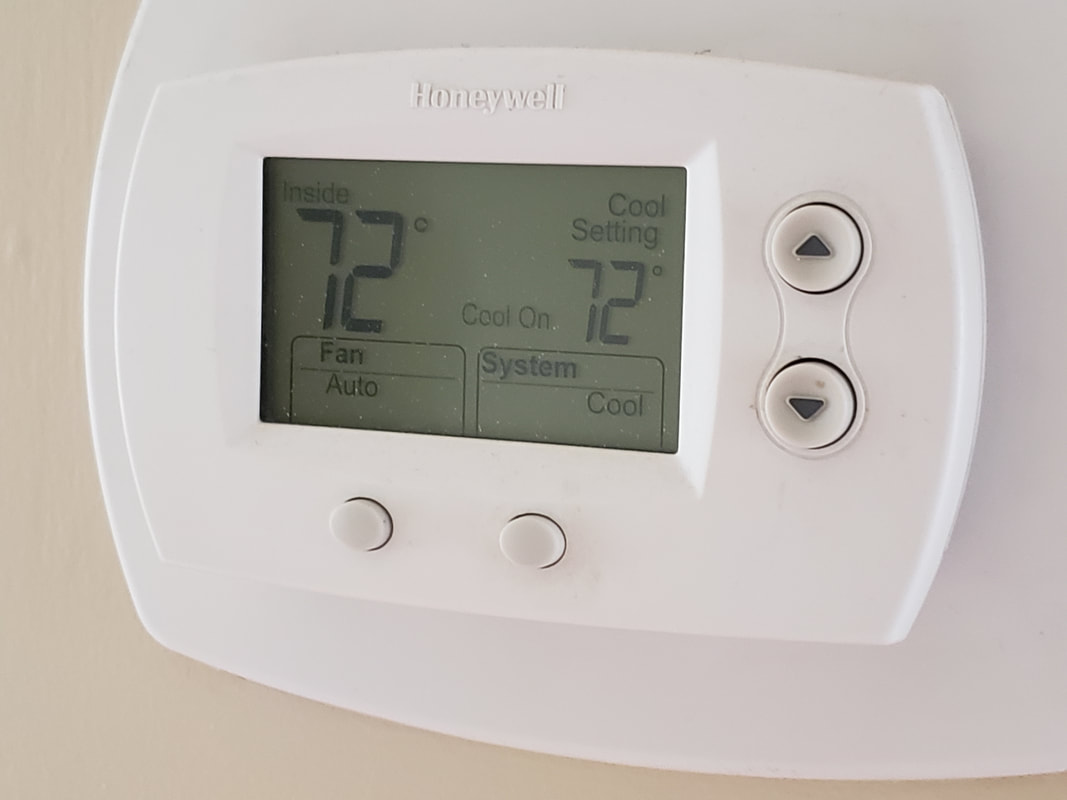
ConsistencyEach day of testing, the thermostat was set to 72 degrees to achieve an approximately consistent temperature in the room. An air register was within 10 feet of the experiment, 20 feet from the front door, and 3 feet from the air intake manifold.
|
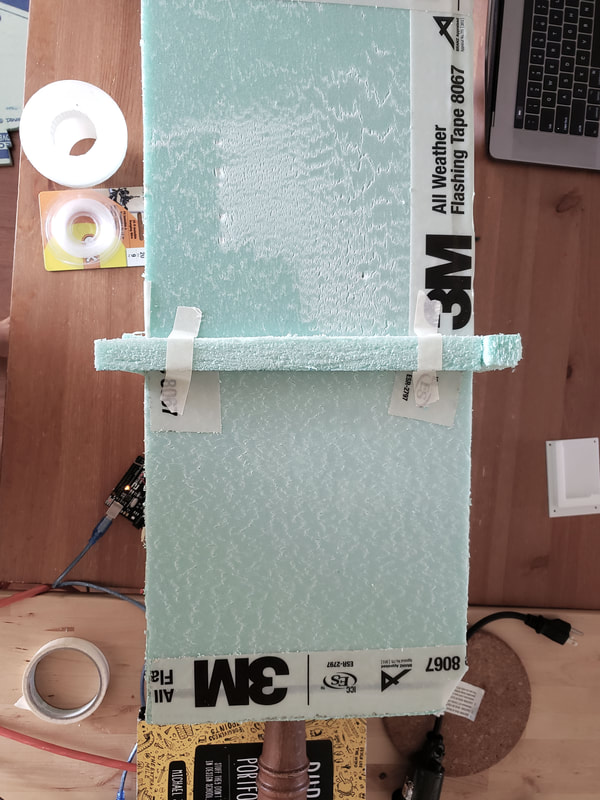
Box Enclosure w/ SealBecause the wood exterior components were not necessary to the experiment, the testing setup was simplified to represent the core of project: to measure temperature transfer through insulative materials. Therefore, the most important factor was to establish consistency by measuring the box with no paneling first, establish the rate of temperature transfer between both sides, and then move on to panel testing. The tested material was coated in insulative foam to minimize any thermal bridging or leakage from the testing chambers into the room. Additionally, the sensor on the heating chamber was started at the same time the testing began, to ensure there was little to no heat loss.
|

|
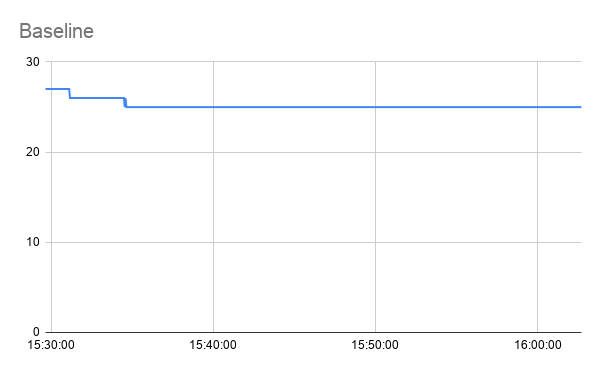
Baseline TestingBefore each day of testing, a baseline reading was taken for 30 minutes, to establish the approximate temperature of the room. The thermostat was typically lowered to 72 before this baseline was taken, so after 30 minutes of air conditioning, the room was at a consistent baseline. This is shown by the flat line of temperature, showing very little/no change in the room after the cooling was complete in the room. After that thirty minutes and a plateau of the room's temperature was confirmed, testing would begin.
|
|
|
|
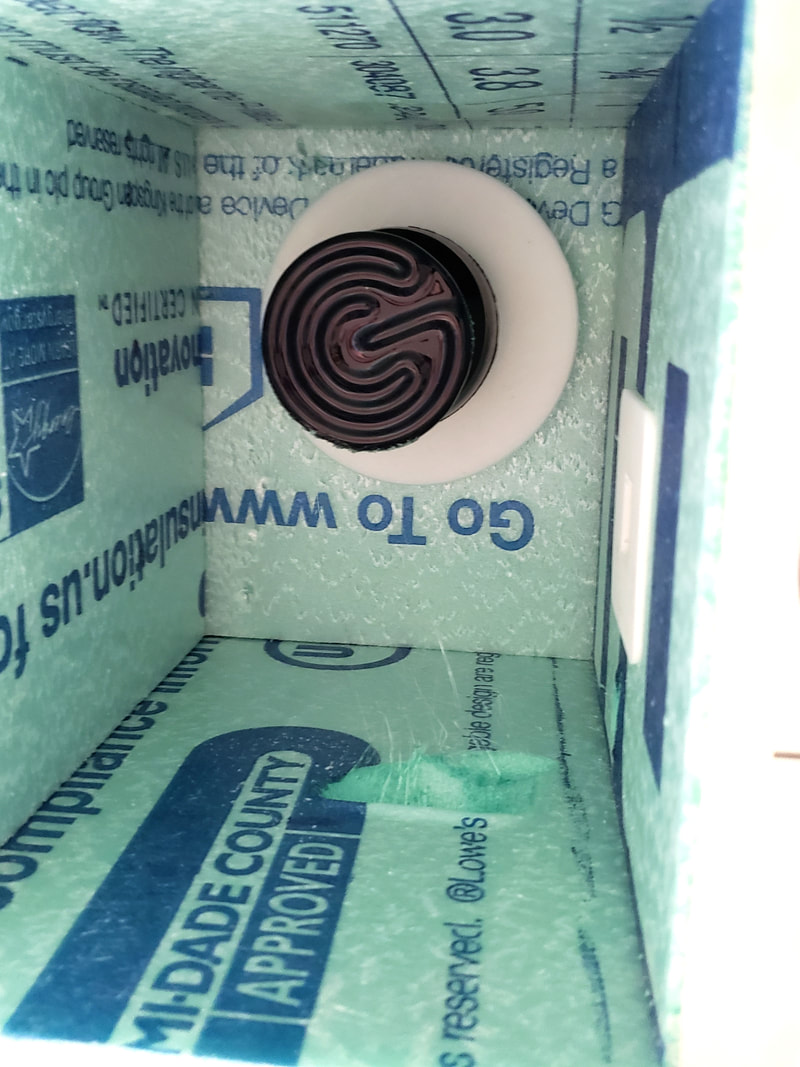
Test w/ No PanelA trial run was conducted with no insulative testing panel to ensure all components would work. This was helpful to determine the original heat lamp was far, far too powerful and damaged the testing chamber slightly. The bulb was then replaced with a 25 Watt, powered by 120V lamp (off-the-shelf.) The 25W proved to be more than enough still, as the heat chamber regularly surpassed the measuring capabilities of the DHT11 sensor that was used.
|
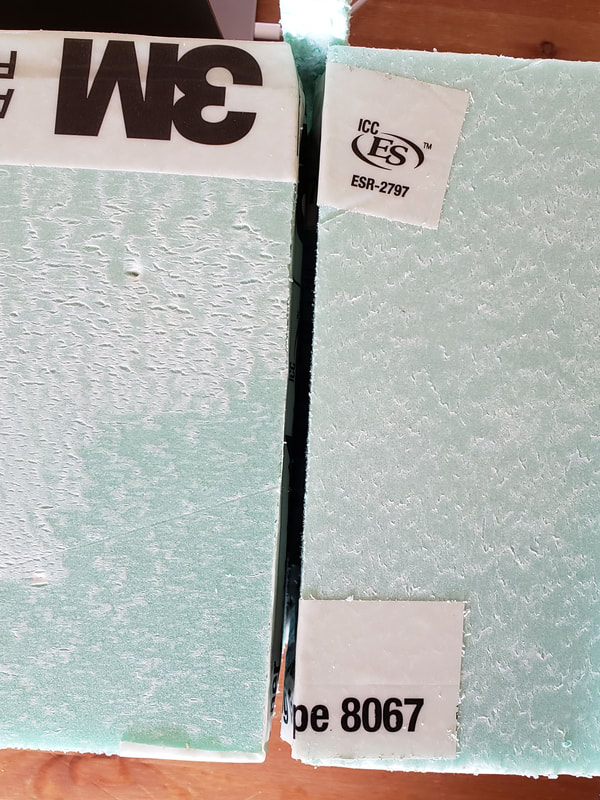
Control (Rigid Foam Insulation)
After the box was measured for a baseline,
|
|
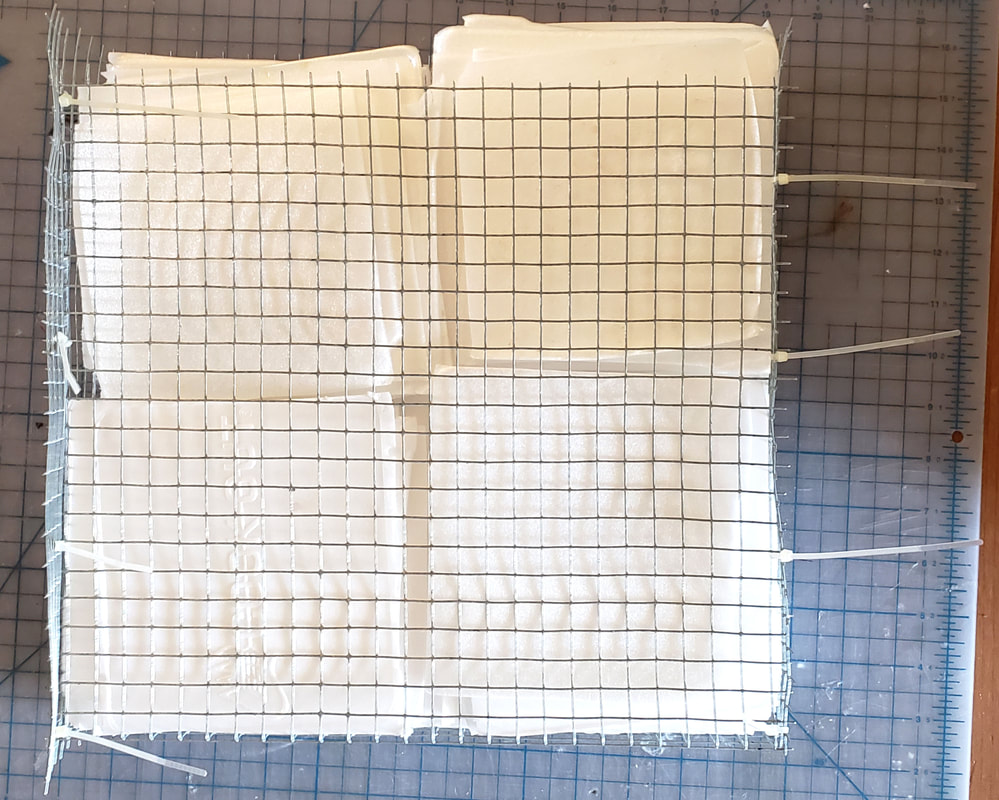
Cut Styrene PanelThe styrene was tested in a cut pattern, then stacked into a wire mesh gabion, zipped together. The image shown was the original orientation of the panels, but after some testing the panels were shifted to overlay on the center lines, to minimize thermal breaks. It was acknowledged that the metal wire likely had some level of heat transfer, though the foam did require a firm container because of its tendency to expand against compression.
|
Shredded Styrene PanelThe shredded panel used the scrap edges the panel system created, cut using a mandolin to create strips of styrene. This was packed into the screen system and sewn together. There was a great deal of air between the pieces relative to the panel system, though the shredded panel could be compacted further with industrial strategies.
|

|
CooldownAfter each test, a cooldown period commenced to let both the air in the chamber, and the sensor itself cool down. Because there is metal in the sensor, the cooldown period took longer than what was actually needed to cool the air in the space (as the metal retained the heat for longer than the air would.)
During the relay testing, a faster method for cooling down the air in the chamber (and sensor/bulb) by placing a cup of ice in the chamber, which would absorb the residual heat. After the ice was removed, the sensor continued measuring the temperature to ensure the space was not cooled below room temperature. When the Baseline temperature was achieved once more, the next test in the process would begin. |
|
Relay Testing
|
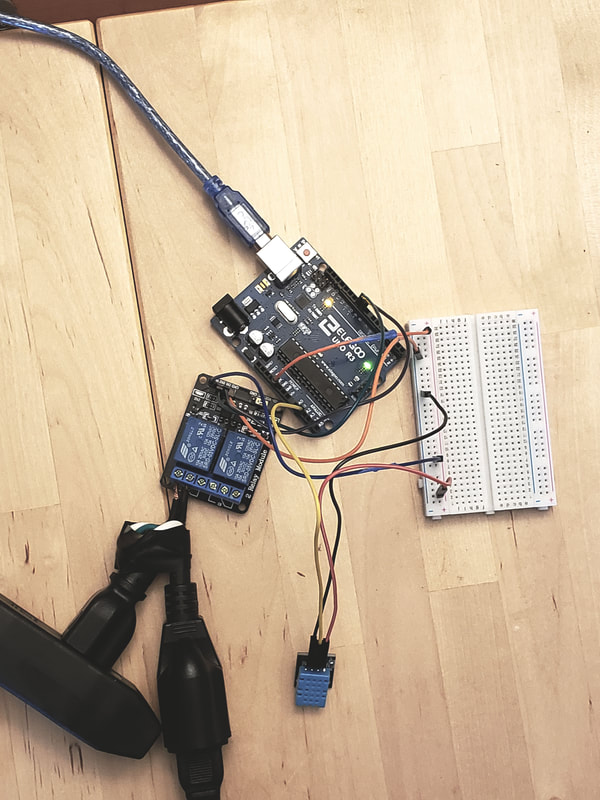
After the 30 minute fully-on trials had finished, more investigation was performed to see what impact a longer, less hot trial would have on the testing materials. The 25W bulb was set on a relay to keep the temperature of the warming chamber between 100~110F, otherwise the testing setup was the same.
The intent here was to stray from the temperature buffering capacity, and focus more on the occupational insulation performance. Specifically, imitating a hot North Carolinian day, as if the air conditioning had failed to see how quickly the space would warm if insulated by the tested material. |
|
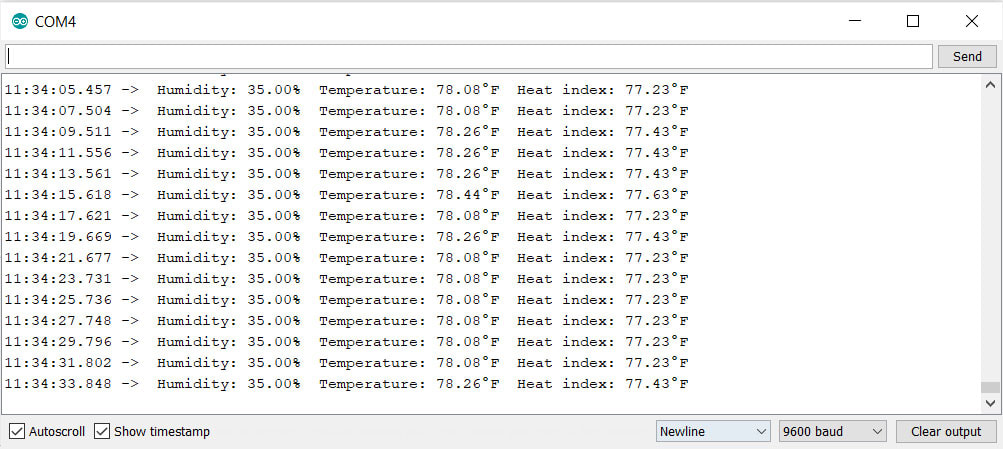
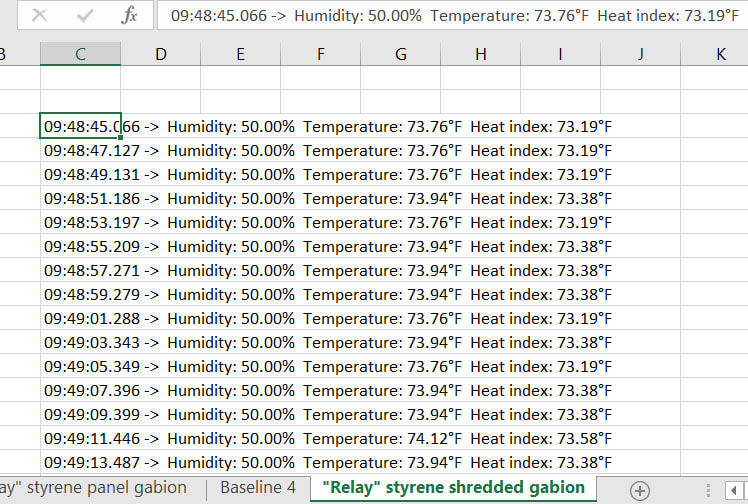
Serial MonitorThe serial monitor output was cleared the moment the testing began, and ran during the entire duration of testing to monitor the interior temperature of the cube. This way, the temperature measurements could return to the temperature of the room measured during the baseline reading.
|
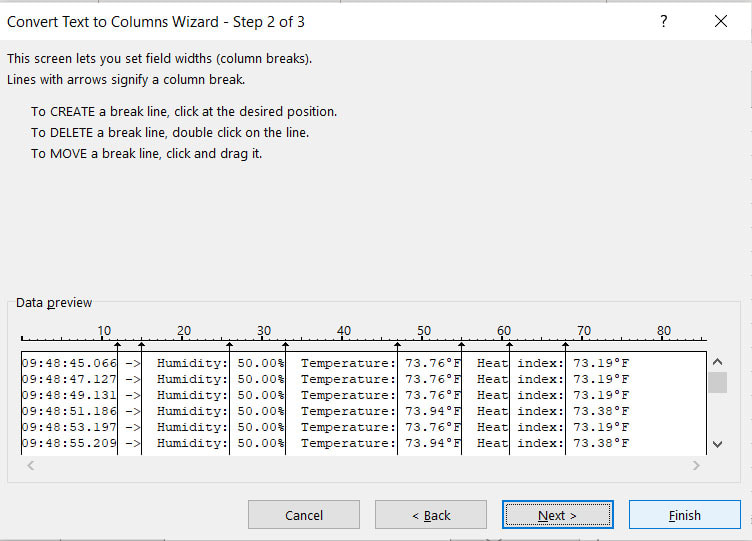
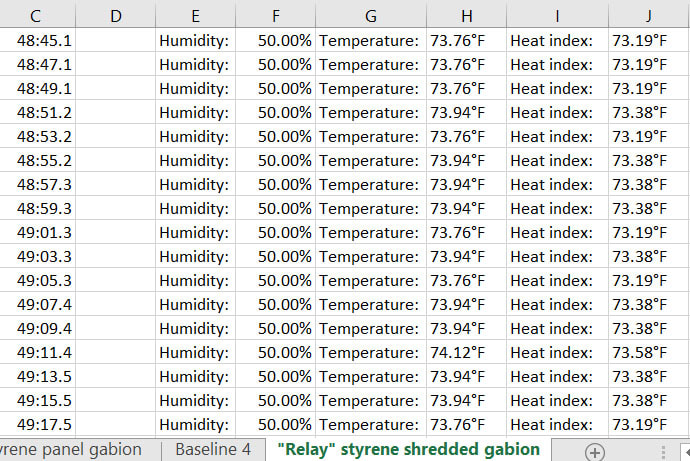
Exporting and SortingSome alterations to the data output stream were necessary to make the data processable by data parsers, and ensuring the data could be graphed as information.
|
|
|
|
|
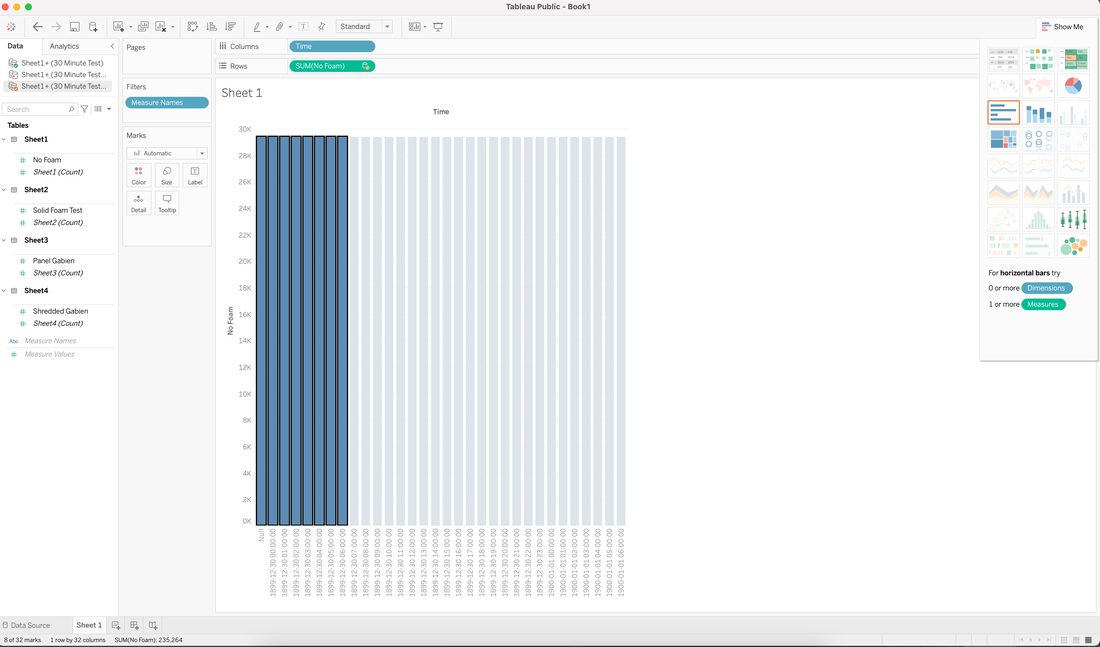
ParsingThis information was parsed using tableau, then uploaded to the website.
|