HIGH-PERFORMANCE, LOW-TECH
  • Projects
    • Environment Box
    • Passive Refrigeration
    • Water Cooling
    • Fog Catching
    • Roof Geometries
    • Optimal Insulation
    • Cooler Windcatcher
    • Green Machine
    • Mitigating Humidity
    • Convective Air Flow
    • Styrene Reuse
    • Thermal Reflection
    • ETFE Rigidification
    • Phase Change Materials
    • Polar Reflection
    • Cavity Depth Variation
    • Vapor Permeability
    • Algae Facade
    • Moisture Buffering
    • Engineered Geometries
    • Recycled Desiccant Materials
    • Living Wall
    • Solar Shading Facades
    • SHADESin.reACTION
    • Low-Fab Dehumidification
    • Breathing Wall
    • Urban Heat Island
    • Acoustical Design
    • Latent Heat of PCM's
    • Insulative Qualities of Air
  • About
  • Lectures
    • Building Science Basics I
    • Building Science Basics II
    • Research & Literature Review
    • Scales of Fabrication
    • Electronics
    • Methodology
    • Graphical Excellence
    • Moving Graphics
  • Assignments
    • 1: Research Proposal
    • 2: Prototype
    • 3: Data
    • 4: Design Proposal
    • Presentation & Paper
  • Workshops
    • Thermal Scavenger Hunt
    • Balance Point Game
    • Advanced Shop Training
    • Basic Electronics
    • Advanced Electronics
    • Excel & Illustrator
    • Data Visualization
    • Videos
    • Animations
  • Syllabus
  • Resources

ARDUINO CODE 

WHEN GATHERING THE RESISTORS FOR PROJECT MAKE SURE TO NOT MAKE THE MISTAKE AND GRAB 100K RESISTORS! THE CODE RECCOMENDS 100 ohms. WHEN LOOK FOR 100 ohms, SELECT THE RESISTORS WITH JUST THE NUMBER "100" WRITTEN ON THEM.

MOCK-UP / TESTING CODE

THE CODE WAS FIRST TESTED WITH BUZZERS TO MAKE SURE THE CODE WAS WORKING. FOR FINAL CONSTRUCTION THE SPEAKERS WILL BE ADDED.

FINAL CODE AND CONSTRUCTION

Picture
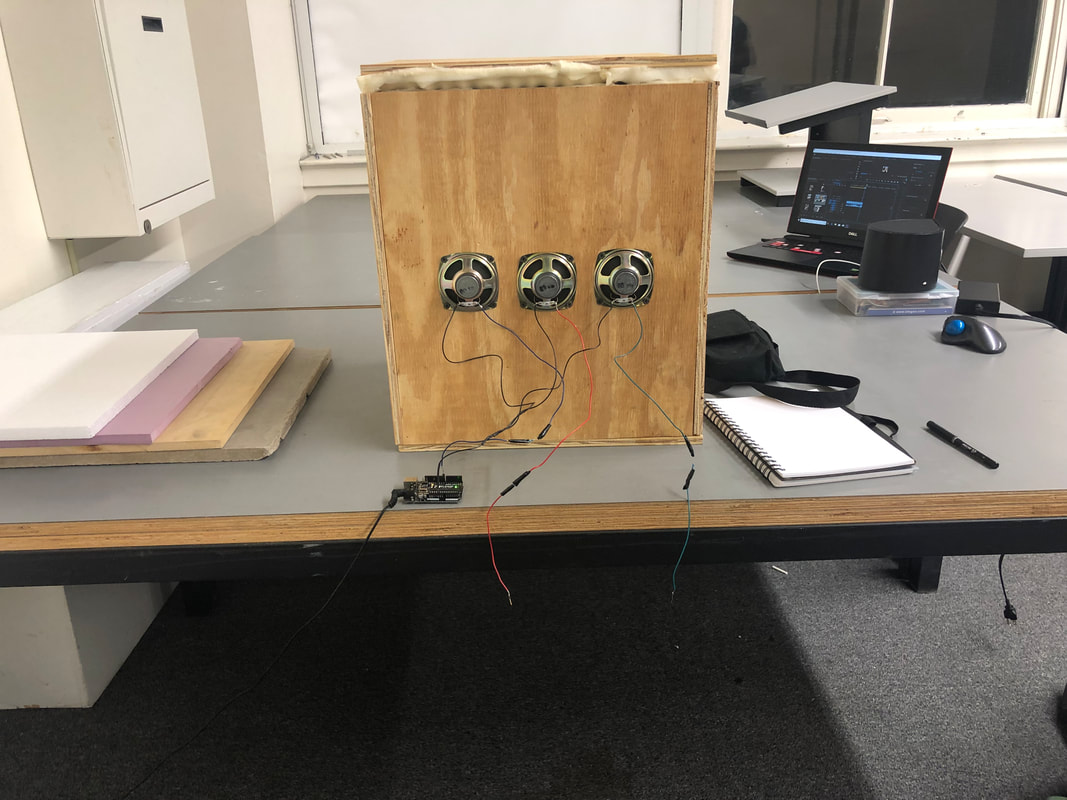
Overview of the Experiment/Design
   The sound box will test different building materials for sound absorbency. Without building a sound proofing wall, this experiment will be able to test what material on its own will be able to absorb noise at different decibels.

The results will be measured by using a 5-N-1 reader to be able to record the changes in air pressure caused by sound waves which will then be converted into an electrical signal, and displaying the resulting sound pressures read in decibels.

The different frequencies that will be tested through the speakers are 20 Hz to 16kHz over a three minute period.

Population/Sample
   By using the inner testing chamber the 5-N-1 will be able to assess the noise of sound level coming from the tested material.

SAMPLES THAT CAN BE TESTED 

Any building material that can be cut down to fit inside the testing slot
Material examples: 
            Concrete 
            Insulation Foam 
            Styrofoam
            MDF (Medium Density Fiberboard)
            Cardboard
Location
    The sound box should be placed in an area that is relatively quiet so the 5-N-1 can accurately test the noise levels moving through the testing material.

 Restrictions/Limiting Conditions
      Sound travels like air and this can cause for some of the test results to read inaccurately. Testing each side of the box to make sure it is sound proof is a pertinent part of the experiment.
          
Sampling Technique / Procedures
      Step 1 : Figure out what material you want to test and cut it down to fit inside the book. Make sure your material fits inside tightly.
      Step 2: Build a box with a detachable lid that is composed of squares that are 2’ by 2’
(YOU WANT THIS TO PORTABLE AND EASY TO ACCESS DO NOT MAKE SMALLER THAN 1’ by 1’)
      Step 3: Use inner chamber to add testing material 
      Step 4: Turn on speaker and 5-N-1 
      Step 5: RECORD FOR THREE MINUTES OR WHEN 5-N-1 IS CONSTANT.

Materials to Build Testing Box
    MDF OR PLYWOOD
    5-N-1
    ARDUINO STARTER KIT
    ARDUINO SPEAKERS
    SOUND PROOFING FOAM OR BED FOAM TOPPER
    WOOD SHOP EQUIPMENT 
    ANY TESTING MATERIAL LISTED ABOVE 

 Variables
    The decibels
    Amount of Sound getting inside of testing chamber 
    Size of samples 
    Average thickness of testing materials
    Amount of noise in the room where testing chamber is          located

Statistical Treatment
    Use excel graphs to record data and compare test results from one material to another.

  • Projects
    • Environment Box
    • Passive Refrigeration
    • Water Cooling
    • Fog Catching
    • Roof Geometries
    • Optimal Insulation
    • Cooler Windcatcher
    • Green Machine
    • Mitigating Humidity
    • Convective Air Flow
    • Styrene Reuse
    • Thermal Reflection
    • ETFE Rigidification
    • Phase Change Materials
    • Polar Reflection
    • Cavity Depth Variation
    • Vapor Permeability
    • Algae Facade
    • Moisture Buffering
    • Engineered Geometries
    • Recycled Desiccant Materials
    • Living Wall
    • Solar Shading Facades
    • SHADESin.reACTION
    • Low-Fab Dehumidification
    • Breathing Wall
    • Urban Heat Island
    • Acoustical Design
    • Latent Heat of PCM's
    • Insulative Qualities of Air
  • About
  • Lectures
    • Building Science Basics I
    • Building Science Basics II
    • Research & Literature Review
    • Scales of Fabrication
    • Electronics
    • Methodology
    • Graphical Excellence
    • Moving Graphics
  • Assignments
    • 1: Research Proposal
    • 2: Prototype
    • 3: Data
    • 4: Design Proposal
    • Presentation & Paper
  • Workshops
    • Thermal Scavenger Hunt
    • Balance Point Game
    • Advanced Shop Training
    • Basic Electronics
    • Advanced Electronics
    • Excel & Illustrator
    • Data Visualization
    • Videos
    • Animations
  • Syllabus
  • Resources